Posted 04/19/15
In my last post I described how I might be able to use the Arduino Uno’s onboard EEPROM to see the world from Wall-E’s point of view, at least for a few seconds at a time. So, now that I’m back home from the Gatlinburg, Tn duplicate bridge tournament, I decided to try my luck at this.
First, I had to make some additional modifications to Wall-E’s program:
- Revised the sensor data retrieval routines to substitute MAX_FRONT_DISTANCE_CM for any zero reported from either front sensor, and to substitute MAX_LR_DISTANCE_CM for any zero reported from either the left or right sensor. This takes care of the problem of sensor readings abruptly transitioning from a near-maximum reading to zero, and back again.
- Revised the EEPROM storage routine to store readings from all four sensors instead of just the two front ones. Data will be recorded until the EEPROM is full, at which point Wall-E will blink all four taillight LED’s twice. Wall-E will continue to run, but won’t store any more data.
- Revised the separate EEPROM readout program to properly read out all four sensor values, instead of just the two front ones.
After making the modifications (and fixing the inevitable bugs), I set Wall-E loose on the world with it’s new EEPROM-storage capabilities. I video’d the run so I would later be able to correlate the EEPROM data with what Wall-E was actually doing at the time. The first run went very well, with Wall-E behaving ‘normally’ (whatever ‘normal’ means for a robot!). I videoed the run until Wall-E blinked its tail-lights to signify it was done recording, and I noted that the run had lasted about 30 seconds (which was too bad, because Wall-E got stuck on a coat rack leg just after running out of storage space! ;-).
The video and the Excel plot are shown below, followed by my post-run analysis
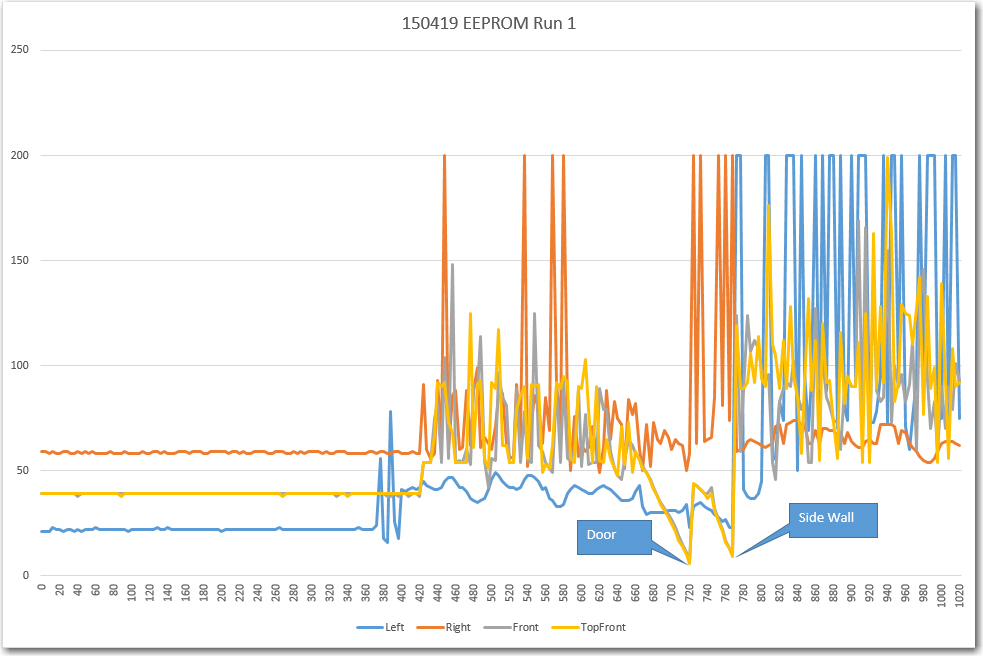
EEPROM data from Wall-E’s first instrumented run
Analysis:
- The very first thing I noticed about the Excel plot is that there is something badly wrong with the first part of the data, up to about point 400; it’s way too constant. After about 400, it looks like Wall-E collected ‘good’ data, although a lot of it looks pretty frightening!
- I thought Wall-E started out tracking the wall on the right, but the data doesn’t support that – it appears it was tracking on the left wall from the get-go.
- from the video it looks like Wall-E’s tracking period is between one and two seconds, and from the plot this corresponds to about 50 points. This correlates reasonably well with the observation that it takes about 30 seconds to fill the 1024-byte EEPROM. 1024 divided by 30 gives 34 points/sec, so 50 points would give a period of about 50/34 = 1.5 seconds. This is actually quite good news, because it means that the 50-point array I was using earlier as part of the ‘stuck’ detection routine can probably capture an entire tracking period. The amplitude of the tracking response appears to be about 8-10 cm in ‘free space’ and about half that when Wall-E’s castering nose wheel was hitting the rug edge after about point 580.
- From the plot, it appears the front and top-front sensors were reporting obstacles in view even though there weren’t any, at least not for the first part of the initial wall-tracking phase of the run. This is probably due to the fairly large heading deviations made by Wall-E even while wall tracking, possibly coupled with some multipath effects. This is actually good news as there should be significant variation in front sensor readings during normal operation, even if there is no dead-ahead obstacle within sensor range. Also, it is clear that once Wall-E came within about 60-75 cm of the door, it ‘captured’ the attention of both the front and top-front sensors, which then tracked the door very nicely all the way down to the 10 cm avoidance threshold. The same thing happened with the side wall, although because Wall-E was moving slower, the distance reversal happened a bit earlier.
- After turning away from the side-wall obstacle, Wall-E tracked the same wall, but in the opposite direction and at a larger distance (about 60 cm vs about 40 on the way in). It is interesting to note that the reported distanced from the front sensors also went up, presumably due to the longer slant-distance to the wall and back during the toward-wall heading excursions (and also probably because Wall-E’s heading excursions weren’t as large due to being slower on the carpet)
- The ‘off-side’ (right sensor on the way in, and left sensor on the way out) showed very large variations – large enough to hit the stops (200 cm max distance) occasionally on the way in, and on almost every heading swing on the way out. The measured distance from Wall-E’s average position on the way out to the far wall is about 150 cm, so a 45 degree heading variation would create a slant range distance of over 200 cm. Smaller heading deviations would also likely create a situation where most of the left sensor’s ping energy bounced away from the sensor, creating a ‘nothing in view’ response.
Posted 04/20/15
Today I made another run with the EEPROM enabled. This time I was fortunate enough to have Wall-E encounter my wife’s stealth slippers, while still in the EEPROM collection window, so I may have captured that data. Unfortunately, Wall-E was uncharacteristically smart enough to figure out he was stuck, and so backed away from the dreaded robot-eating slippers!
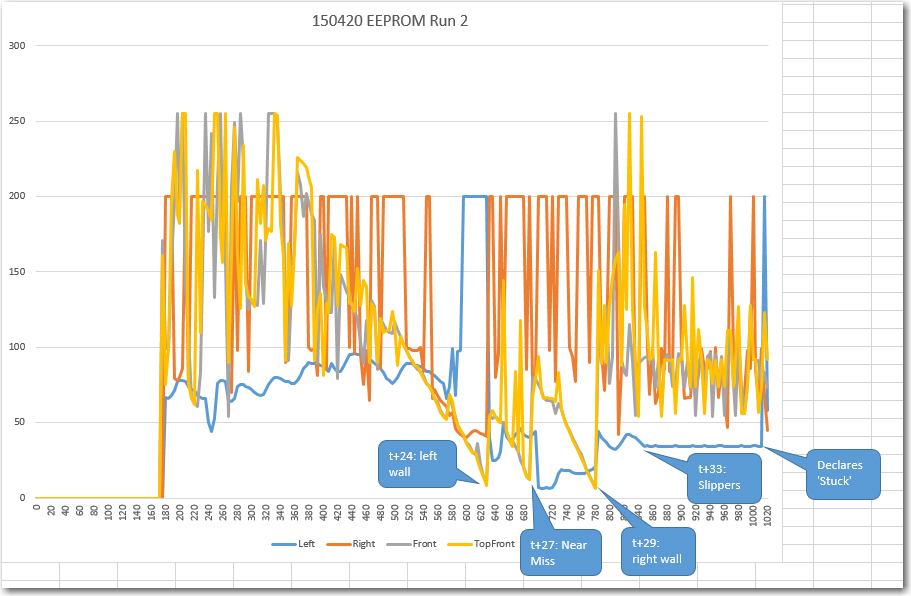
Sensor plot from Run 2. Wall-E triumphs over the ‘stealth slippers’ at the end!
Analysis:
- This plot shows the same disconcerting initial section where the data just doesn’t look correct. However, this time I know where it comes from; Wall-E’s normal running code is configured (now – not for Run 1) to zero out the EEPROM contents before the run starts, and this happens in setup(). When I want to read the information back out again, I need to load an entirely different program, and to do that, I have to connect the USB connector to the Arduino. Unfortunately, this action also powers up the Arduino and sets Wall-E’s normal program running – and practically the first thing it does is start zeroing out the EEPROM. Fortunately it only got through the first couple of hundred data points before being halted by the bootloader, but this is the reason for the initial group of zeros in the plot for Run 2, (and the initial group of too-stable data for Run 1). In the future, I think I’ll incorporate a switchable delay into Wall-E’s programming, maybe using the now-existing pushbutton, so that no data will be zeroed out or overwritten.
- Between point 336 and 358 the front and top-front sensor readings ‘come off the stop’ of 250 cm as they start ‘seeing’ the doorway at the end of the hall.
- T + 24: Wall-E hits the wall to the left of the doorway at point 628 after a hard left turn, and immediately backs up and recovers. The hard left turn occurs when Wall-E’s right sensor picks up the short wall stub to the near right and then, after making an initial correcting left turn, picks up the door itself and ‘wall-follows’ it. This is clearly shown in the data, as the right sensor (red) readings drop below the left ones at that point. Wall-E is programmed to use the nearer wall for wall-following.
- T + 27: Wall-E barely misses the end of the short wall stub. It has been ‘wall-following the door and then short wall on its left side this entire time. Interestingly, between the t + 24 hit and this near miss, the top-front sensor readings vary wildly, but the front sensor ones look fairly smooth. My guess is that the upper sensor was alternately ‘seeing’ the wall stub approaching and the wall well beyond that point, while the lower one was just getting the wall stub.
- T+ 29: At point 684, Wall-E hits the other wall and recovers.
- T + 33: After recovering from the second wall hit, Wall-E runs into the stealth slippers and gets stuck – yay!!
- T + 37: Wall-E gets away!! After 4 seconds, Wall-E manages to figure out that it is ‘stuck’ and backs away from the evil stealth slippers! The sensor data in this 4-second period is extremely interesting, as this is the first time I’ve been able to see what Wall-E is ‘seeing’ when he gets stuck on the evil stealth slippers. As previously assumed (but never confirmed until now!) the left sensor readings show very little variation, making the ‘stuck’ condition very easy to distinguish (at least from the human eyeball viewpoint), but the readings from the other three sensors aren’t so easy to interpret. Contrary to expectations, and my ‘test range’ results, both the front and top-front sensor readings show significant variations (as does the readings from the ‘off-side’ side sensor. The problem is, I have no clue as to why Wall-E got away from the slippers. The current code uses only the top and top front sensor readings to determine the stuck condition, and I can’t see anything in the last 50 records that would cause that determination to succeed. There are two criteria for a ‘stuck’ declaration; if neither the front or top front sensors show significant variation for the last 50 points, or if the difference between the front and top front sensors exceeds more than half the max front sensing distance (255 cm for this run) at any time. There are actually two points within the last 50 that satisfy the second of these criteria (the top front sensor reading goes to 255 but the front sensor reading stays at 120 and 80 respectively), but these don’t trigger a ‘stuck’ declaration – Wall-E stays glued to the slippers for another 2-3 seconds. So, either I don’t understand what my own code is actually doing, or I don’t understand what is actually going into the 50-point deviation tracking arrays, or the EEPROM data isn’t what Wall-E is actually seeing, or some combination of all the above (or something else entirely!).
-
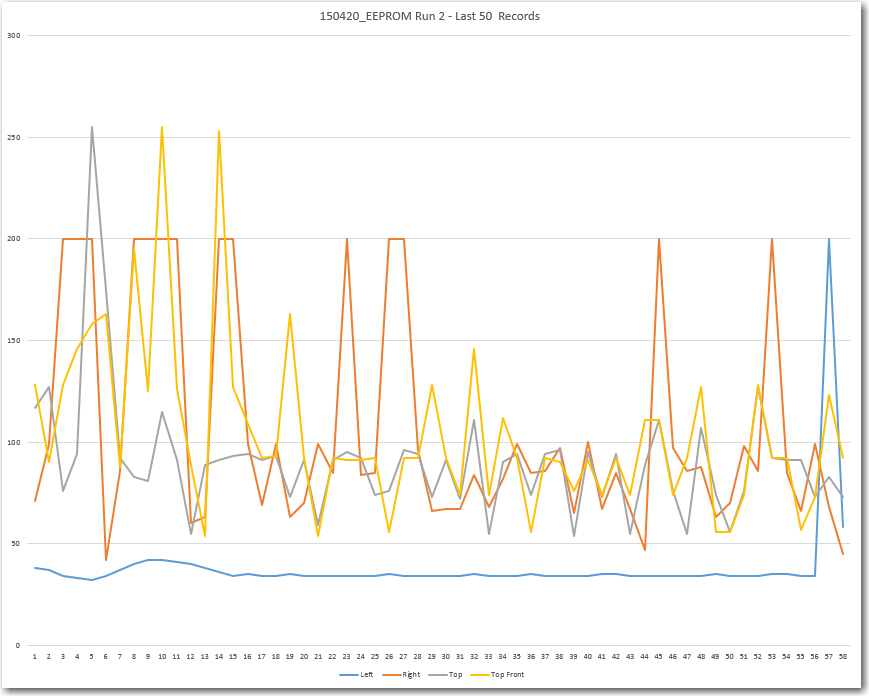
Last 50 records before EEPROM recording ended. Somewhere in here is something that Wall-E used to declare the ‘stuck’ condition.
- T + 39: EEPROM recording ends.

Well, I think I’m making some progress toward understanding Wall-E’s point of view (or maybe it’s his ‘point of hear’ instead?), especially with respect to how Wall-E manages obstacles like the evil stealth slippers. I’m not there yet, although I am encouraged by how stable the left (near wall) sensor data looked while Wall-E was stuck on the slipper. If that behavior can be confirmed by further observations, then it might be an easy and definite way of ‘stuck’ detection.
So, I have modified Wall-E’s code yet again as follows:
- Moved the EEPROM initialization code until after the LED light startup sequence, thereby (hopefully) giving the compiler/load/bootloader code time enough to stop Wall-E’s main program before it wipes out the EEPROM data from the previous run.
- Modified my ‘IsStuck()’ stuck detection function so that if it ever does detect a ‘stuck’ condition, it will
- write the contents of the front and top-front 50-point history arrays to the the EEPROM (either after the newly collected sensor data if there is room, or by overwriting the initial set of sensor readings if there isn’t)
- Light all 4 LEDs
- Shut down the motors
- Enter an infinite loop
By having Wall-E shut down and go to sleep, I can ensure that the ‘stuck’ detection is the very last thing Wall-E does, which should mean that the captured array and sensor data is what Wall-E was using to make the detection.
Then I modified the EEPROM read-out program to print out the array contents in single columns for ease of plotting, with a line in between the array contents and the remaining sensor readout values.
Stay tuned….
Frank