Posted 04/13/15
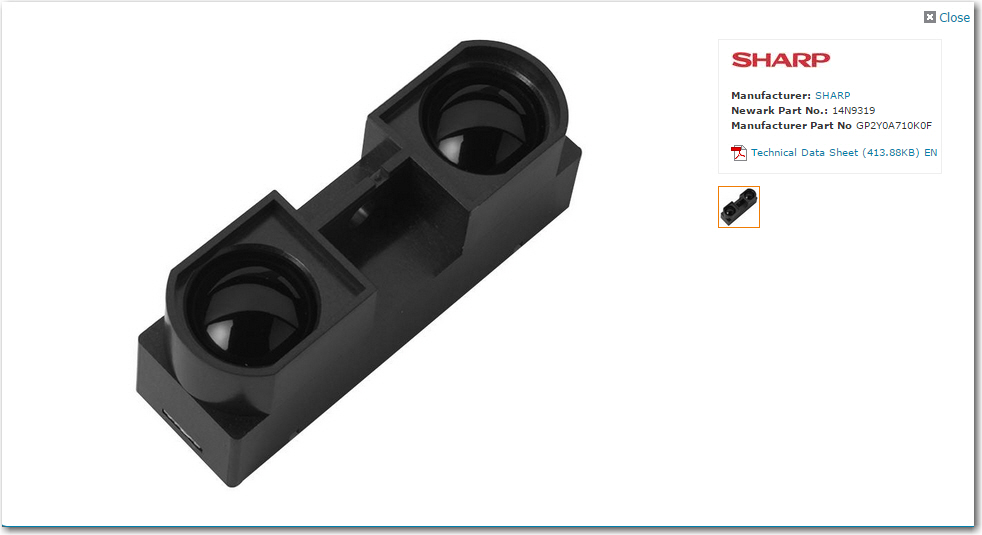
In my last post I described my plans for upgrading Wall-E (my Wall-following Robot) with a LIDAR package of some type, and my thought that I might be able to use such a package to not only replace the existing front-facing ping sensors, but (with a bit of rotating magic) the side sensors as well.
In order to replace *all* the sensors, the LIDAR package would have to rotate fast enough so that it could produce front, left, and right-side distance readings in a timely enough fashion to actually implement wall-following. I’m not sure exactly what the requirements for wall-following are, but I think it’s safe to say that at least the measurements to the followed wall must be in the several-per-second range, or Wall-E could run into the wall before it figures out it is getting too close. The other side, and the front could be taken at a more relaxed pace if necessary, but the wall being tracked has to be done correctly.
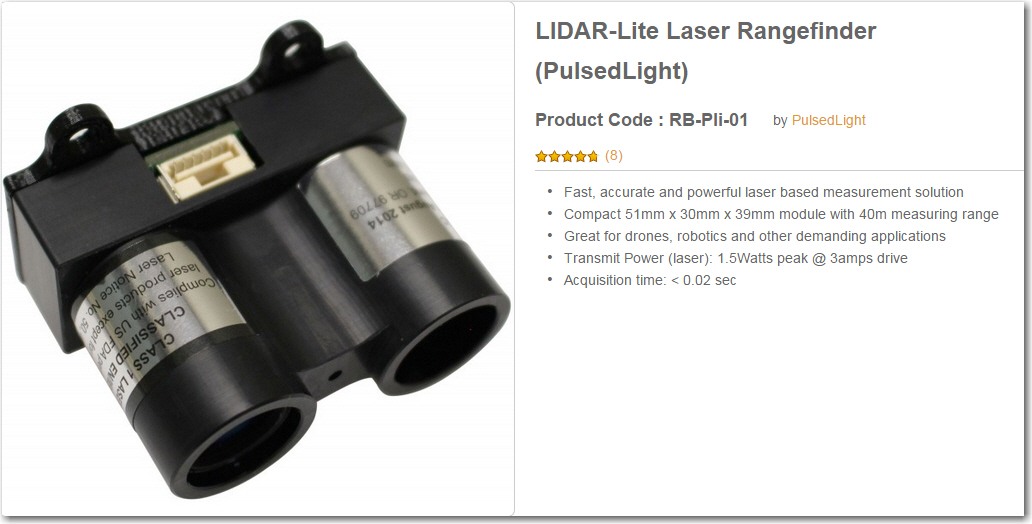
In order to rotate a unit such as the LIDAR-Lite from PulsedLight, I would need a speed-controlled motor of some kind. I considered both stepper motors and direct-drive DC motors. Since I already had two DC motors (the left and right wheel motors on Wall-E) and they came with ‘tachometer sensors’ (plastic disks with slots for optical wheel motion sensing), I thought I’d give this a try. Earlier in my robot startup phase, I had obtained some IR LED/Photodiode pairs, so I had at least the basic building blocks for a tachometer system. I was already speed-controlling Wall-E’s wheel motors for steering using PWM from the Arduino Uno, so that part was already in place. ‘All’ I had to do was couple the input from a tachometer into the already-existing PWM speed control facility and I would have a closed-loop speed-controlled rotating base for my LIDAR system – cool!
OK, so now I have all the parts for a speed-controlled motor system – I just have to assemble them. First up was a way of mounting the IR LED and IR detector in such a way that the slots in the tachometer wheel would alternately make and break the light path between them. In the past when I had to do something like this, I would carve or glue something out of wood, or bend up some small pieces of aluminum. However now I have a very nice 3D printer and the TinkerCad design package, so I could afford to do this a different way. The confluence of hobby robotics and 3D printing allows so much more design/development freedom that it almost takes my breath away. Instead of dicking around for a while and winding up with something half-assed that is used anyway because it is way too much trouble to make another -better – one, a 3D printer based ‘rapid iteration’ approach allows a design to be evolved very quickly, with each iteration so cheap as to be literally throw-away. To illustrate the approach, the image below shows the evolution of my IR LED/IR detector bracket, along with the original 20-slot tachometer wheel that came with the motors and a 10-slot version I printed up as a replacement (the tach signal-to-noise ratio was too low with the 20-slot original).
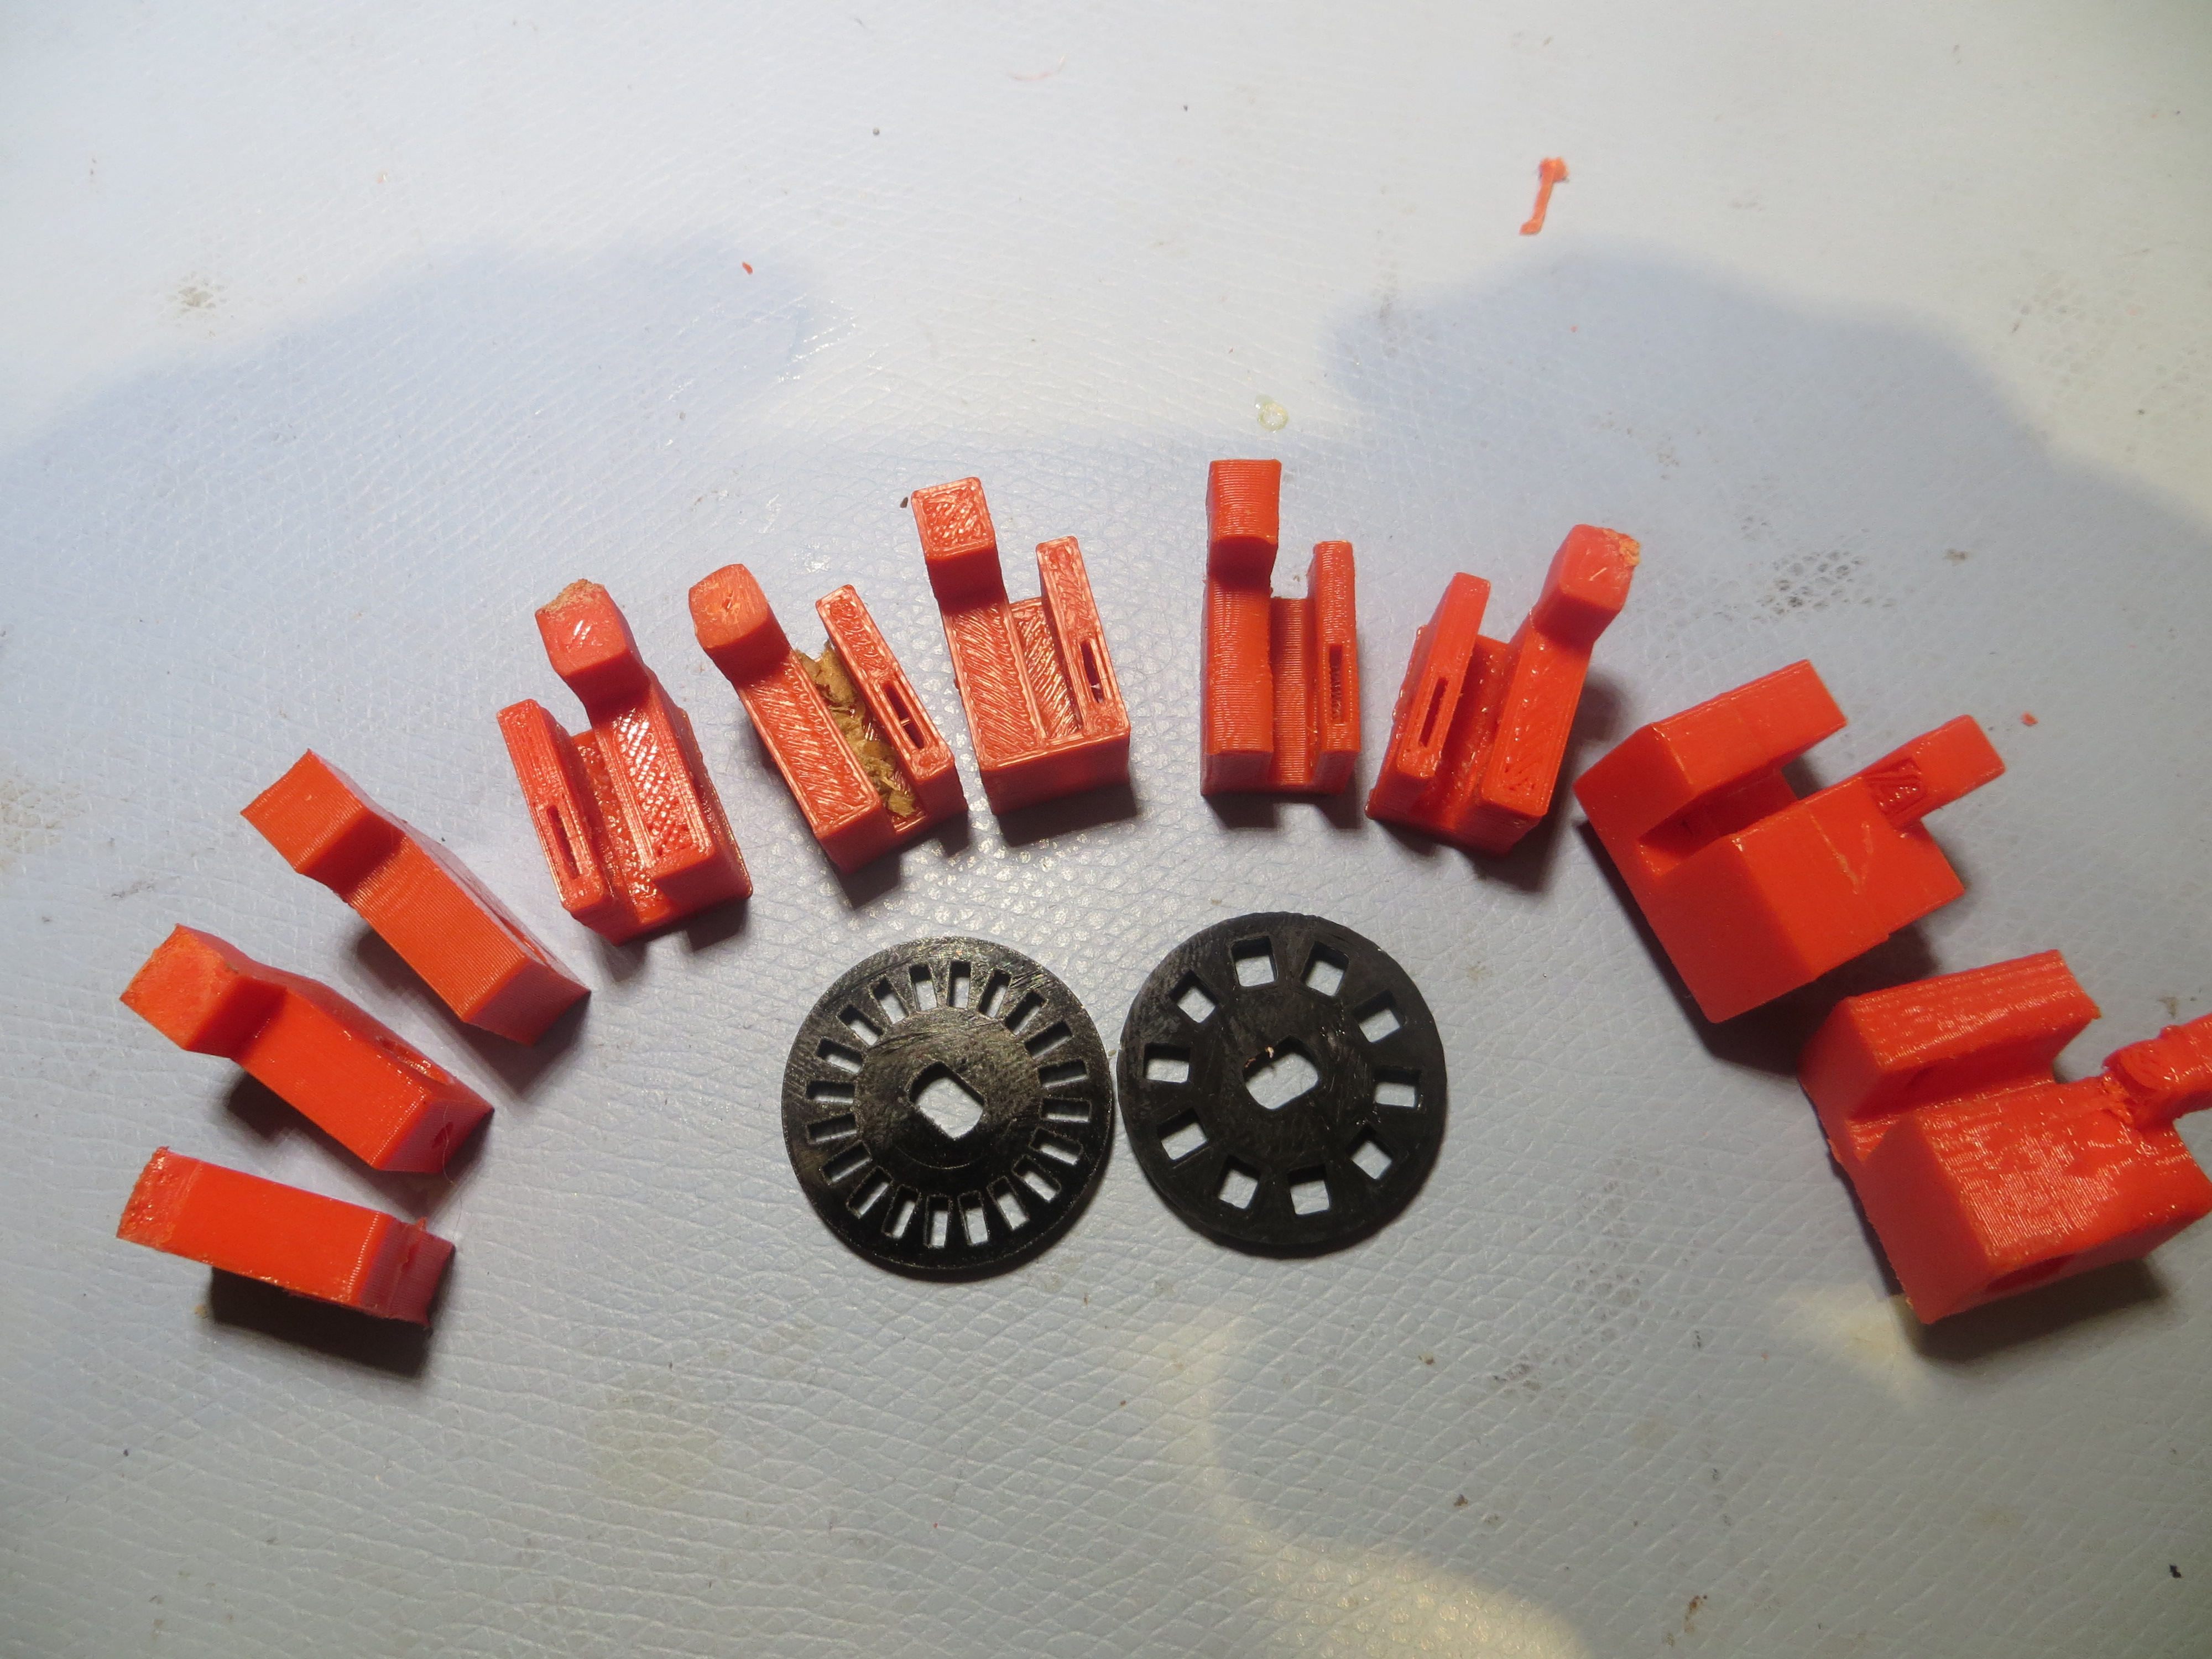
Evolution of an IR tach sensor bracket, along with the original and a custom-printed tach wheel
The evolution proceeded from left to right in the image. I started with just a rectangular piece with a horizontal hole to accommodate the IR LED, and a threaded hole in the bottom to affix it to the robot chassis. Then the design evolved a ‘foot’ to take advantage of a convenient slot in the robot chassis, for physical stability/registration purposes. Then I added a second side with a slot in it to accommodate the IR detector, with the tach wheel passing between the two sides. This basic two-sided design persisted throughout the rest of the evolution, with additional material added on the IR LED side to accommodate the entire length of the IR LED. Not shown in the photo are some internal evolutionary changes, most notably the width of the slot that allows IR energy from the LED to fall on the detector – it turns out that the detector opening should be about 1/2 the width of a tooth slot for best signal. Each step in the above evolution cost me about 30 minutes of design time in TinkerCad, and a few pennies worth of filament. Moreover, once I have the end design, printing more is essentially free. Is that cool, or what?
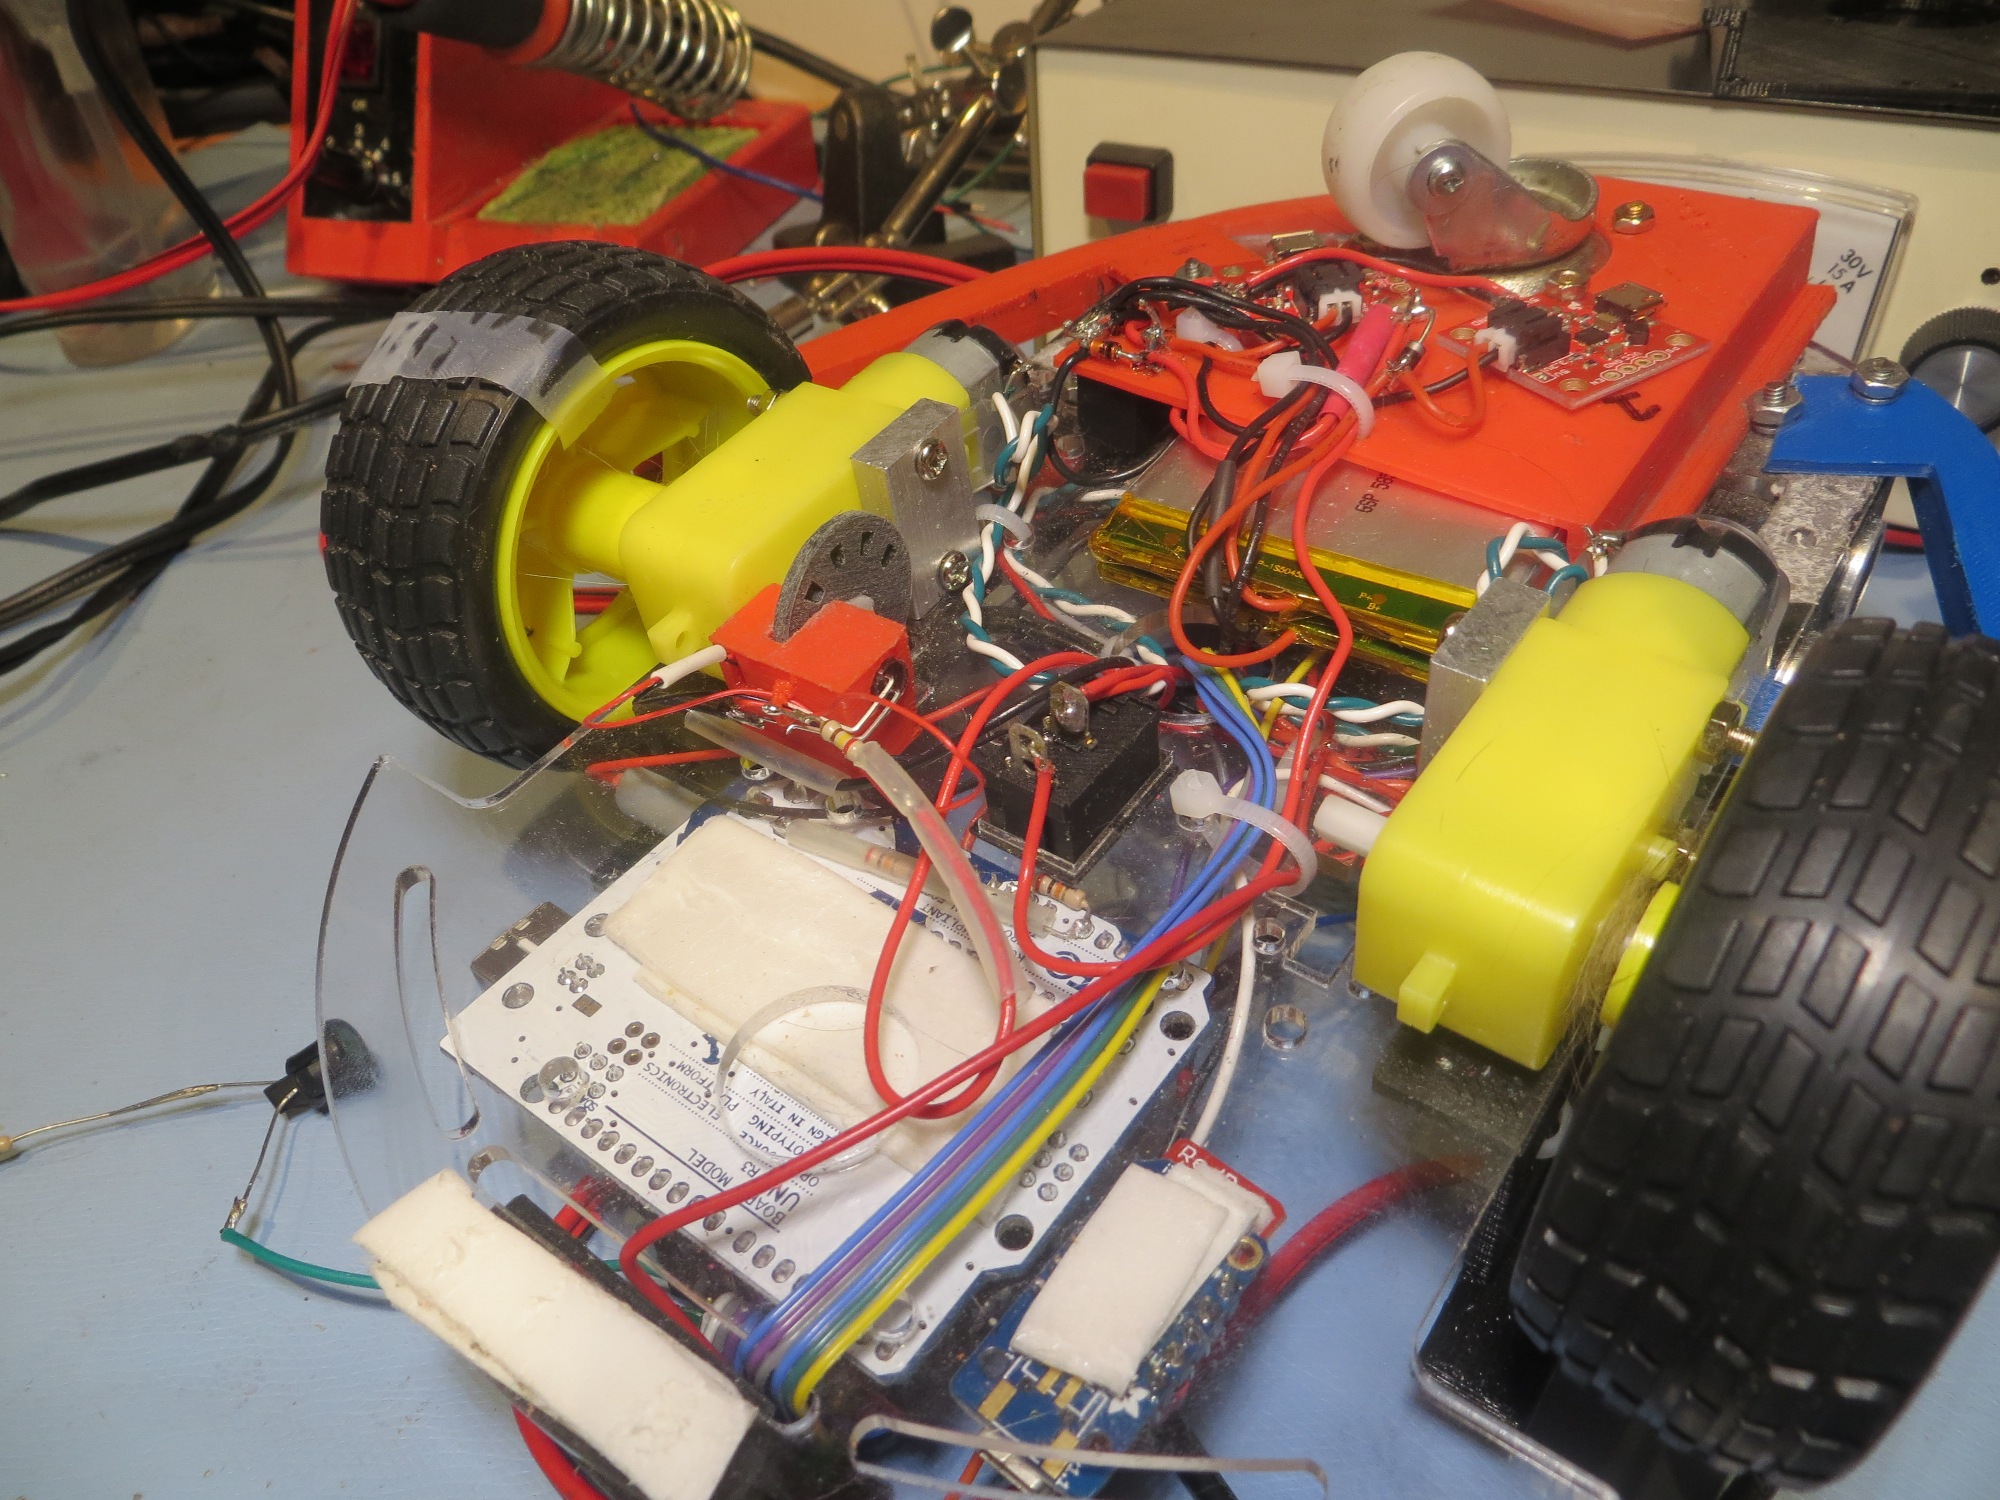
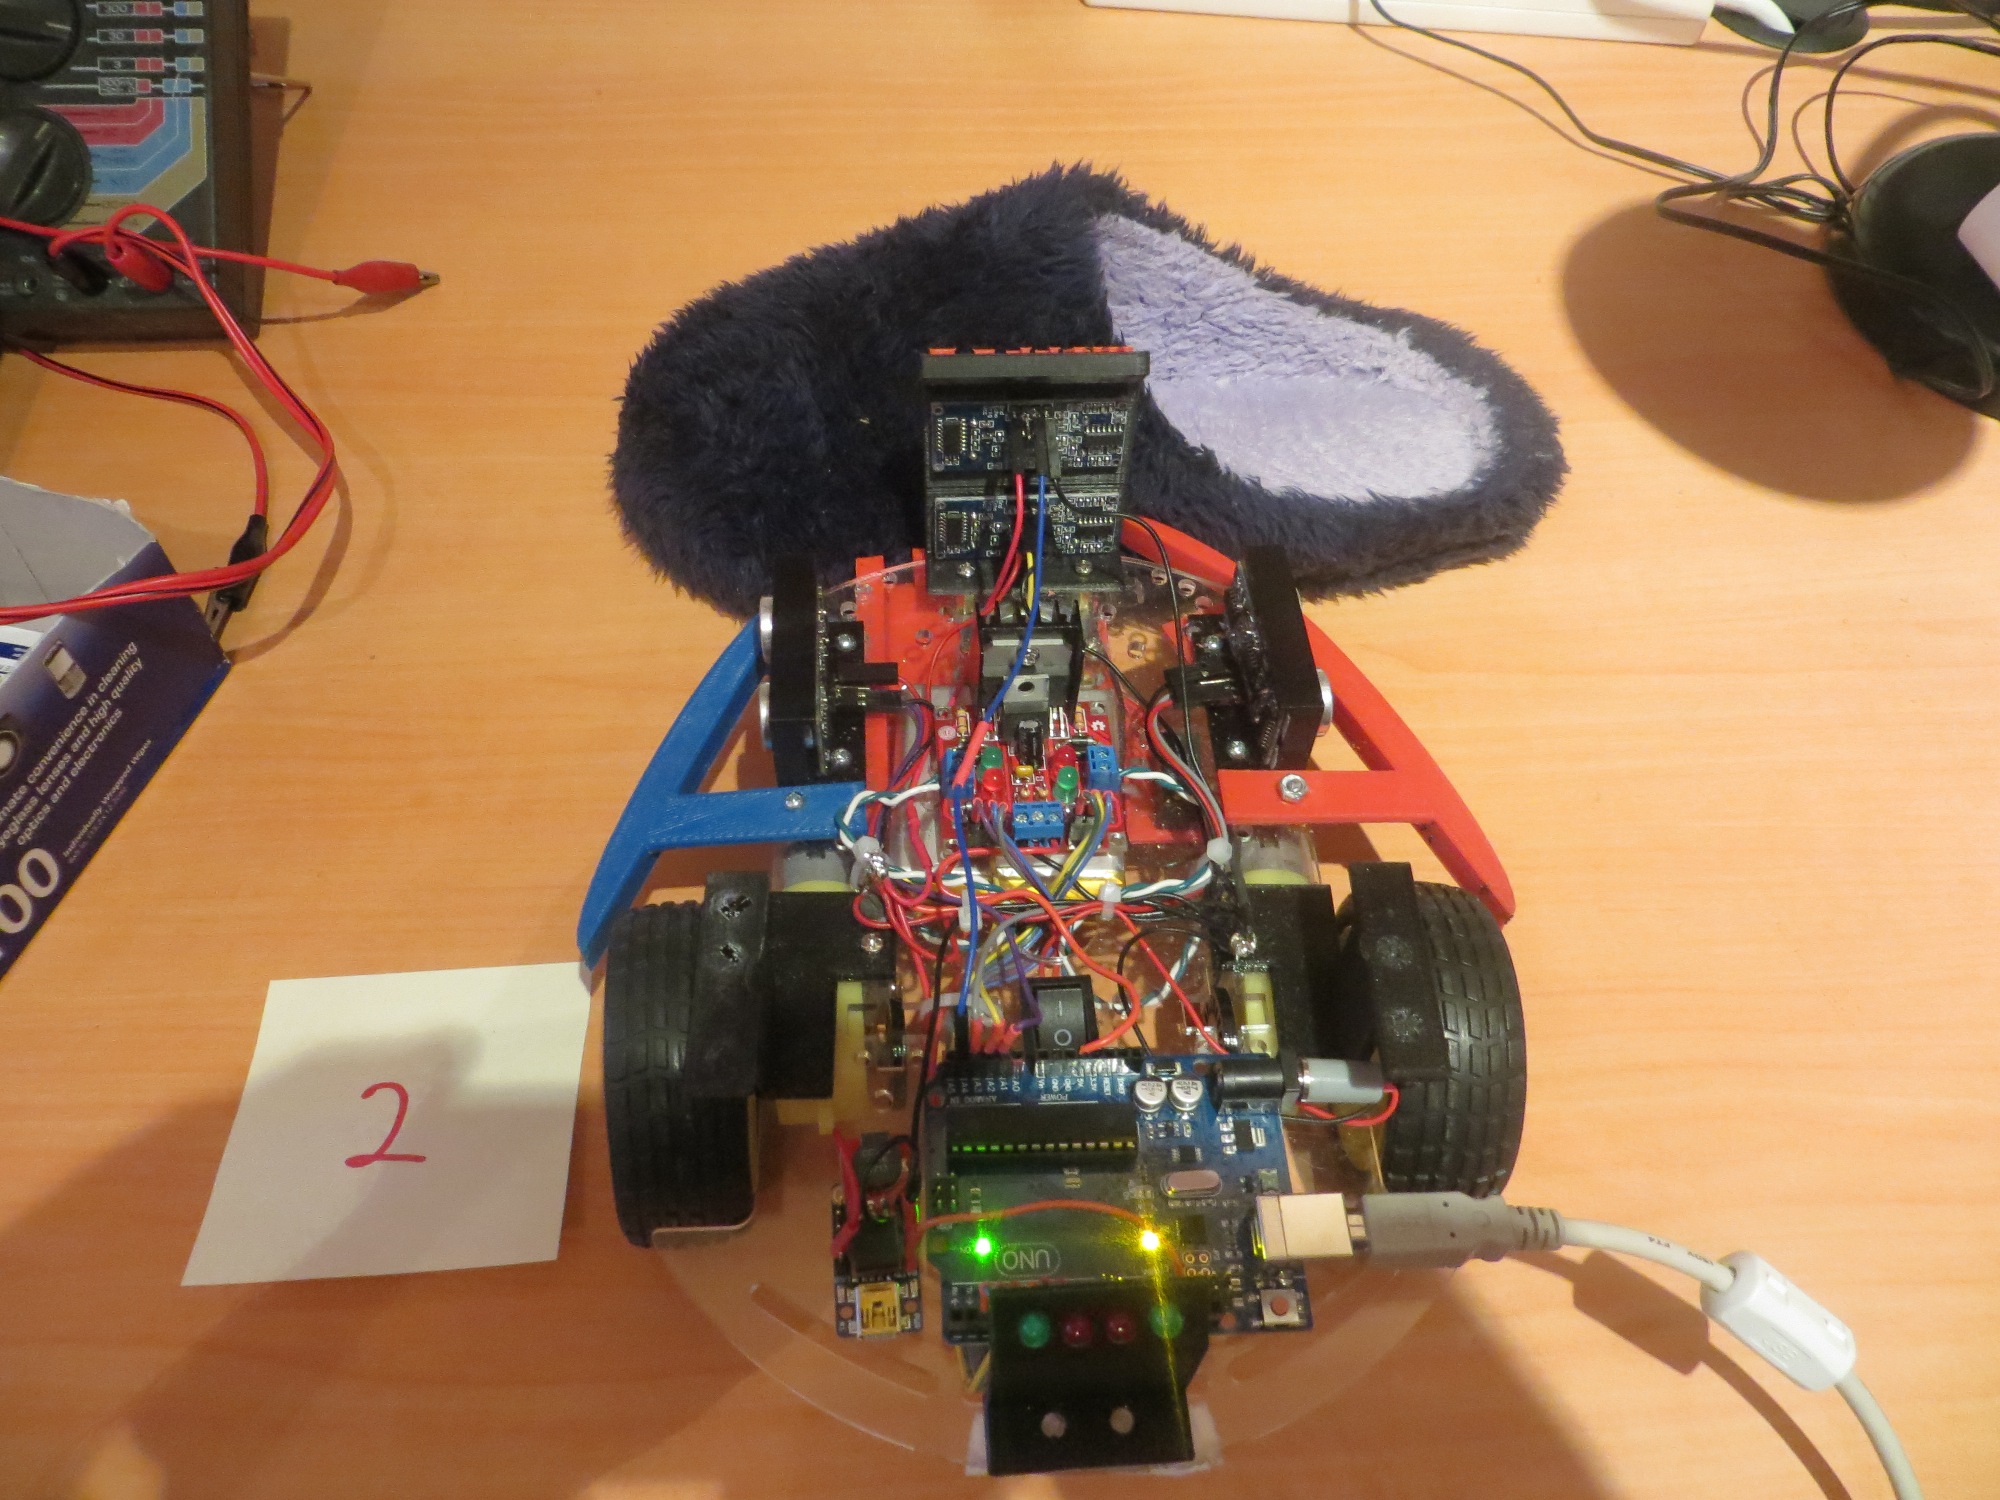
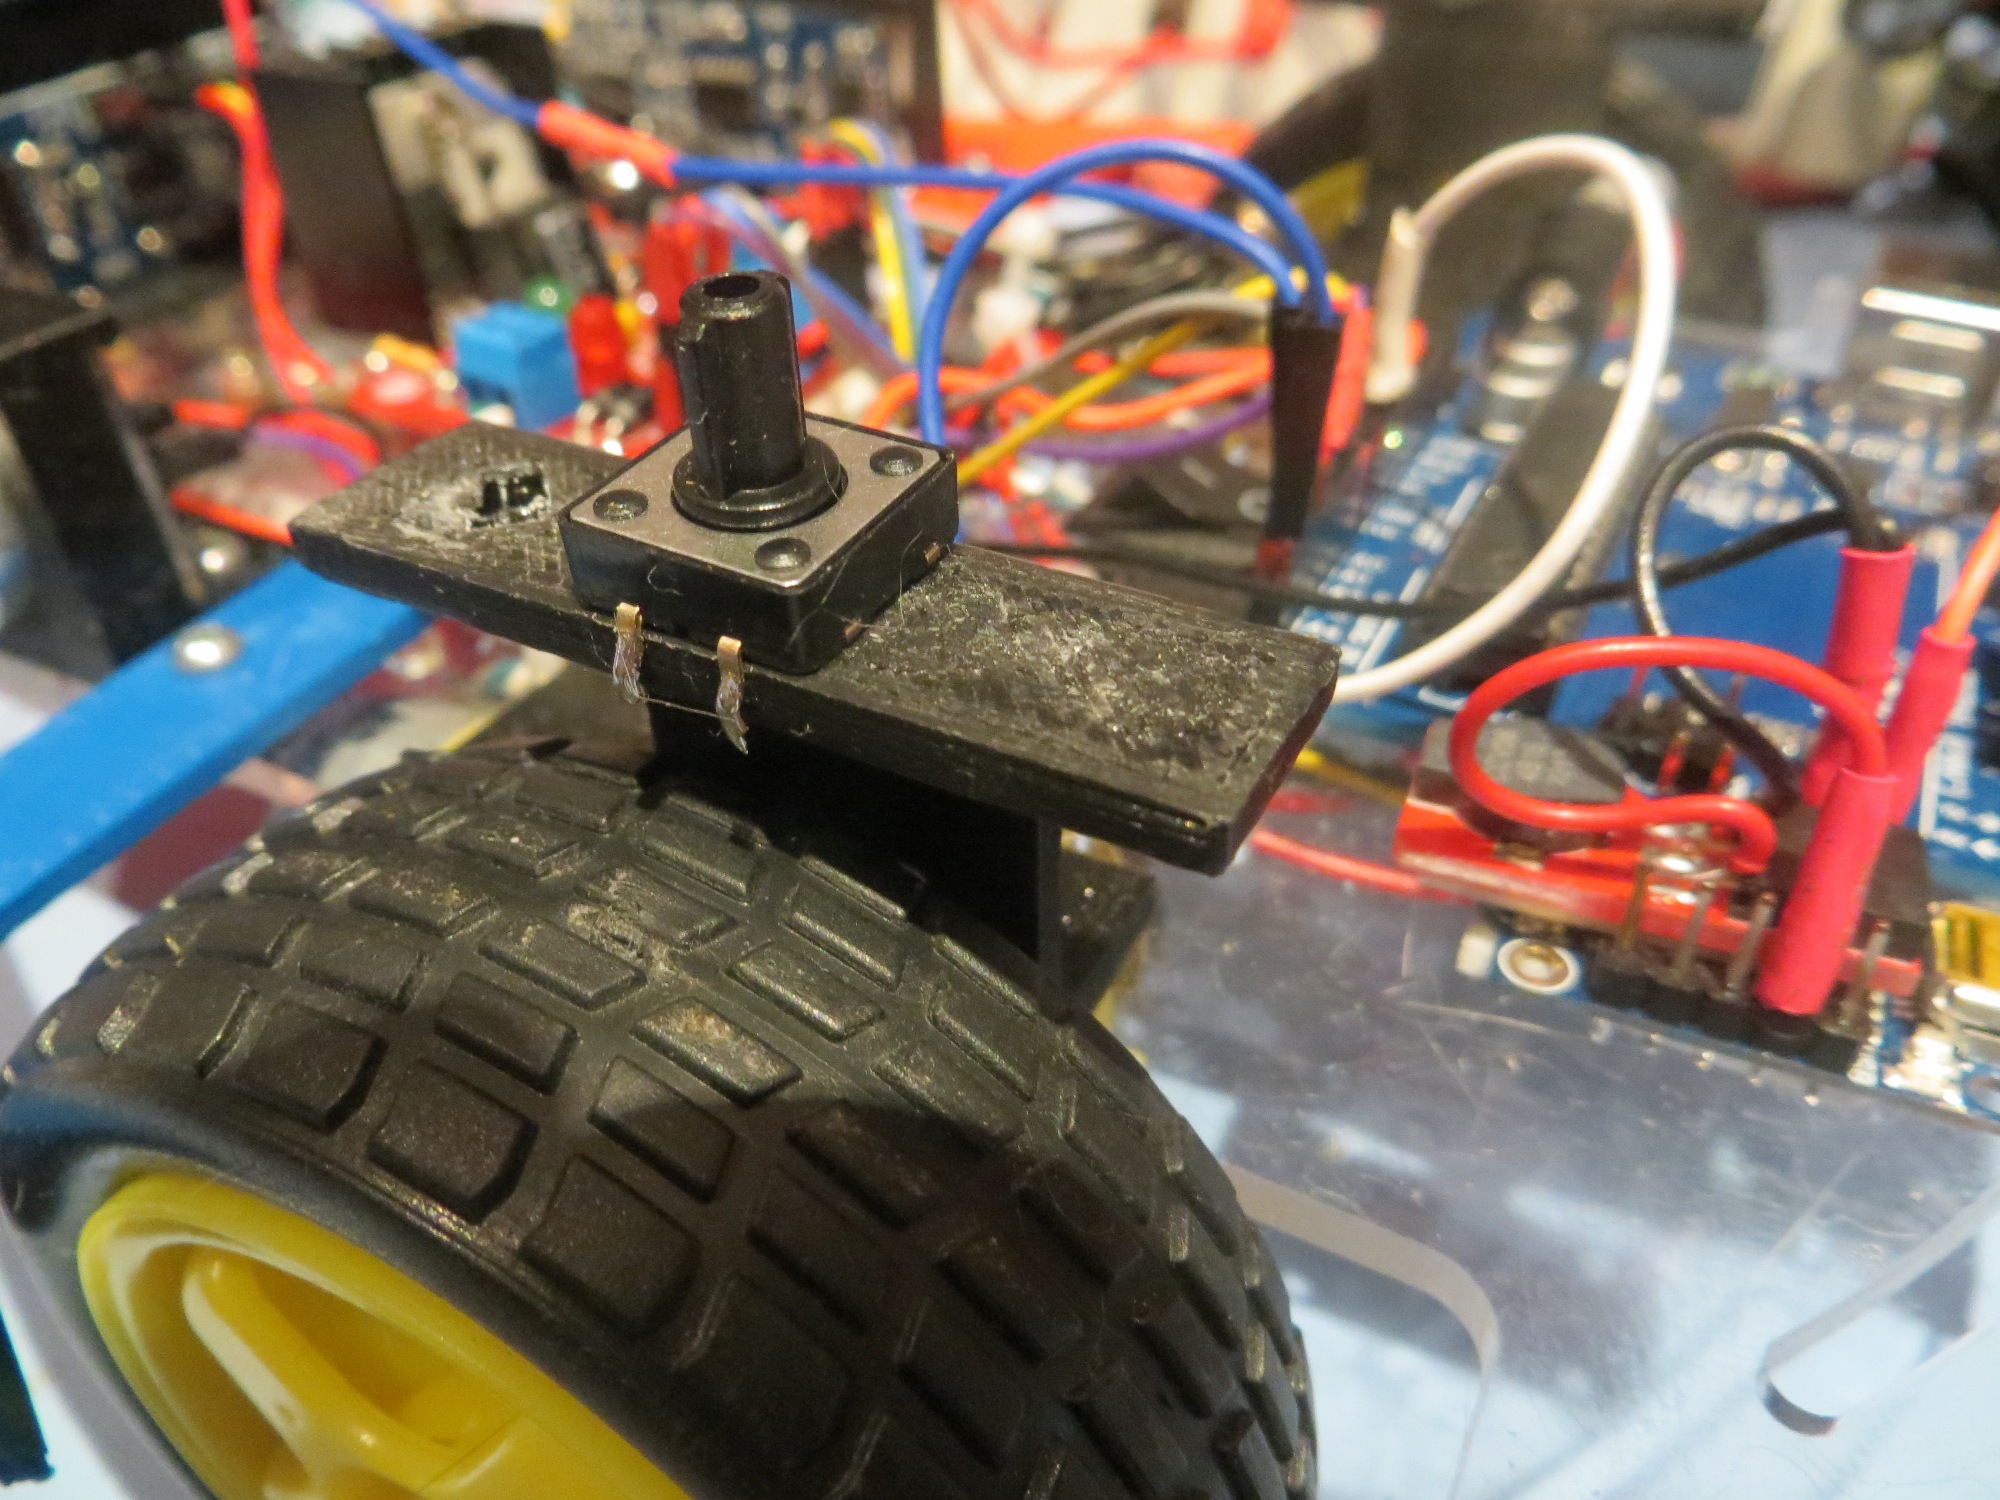
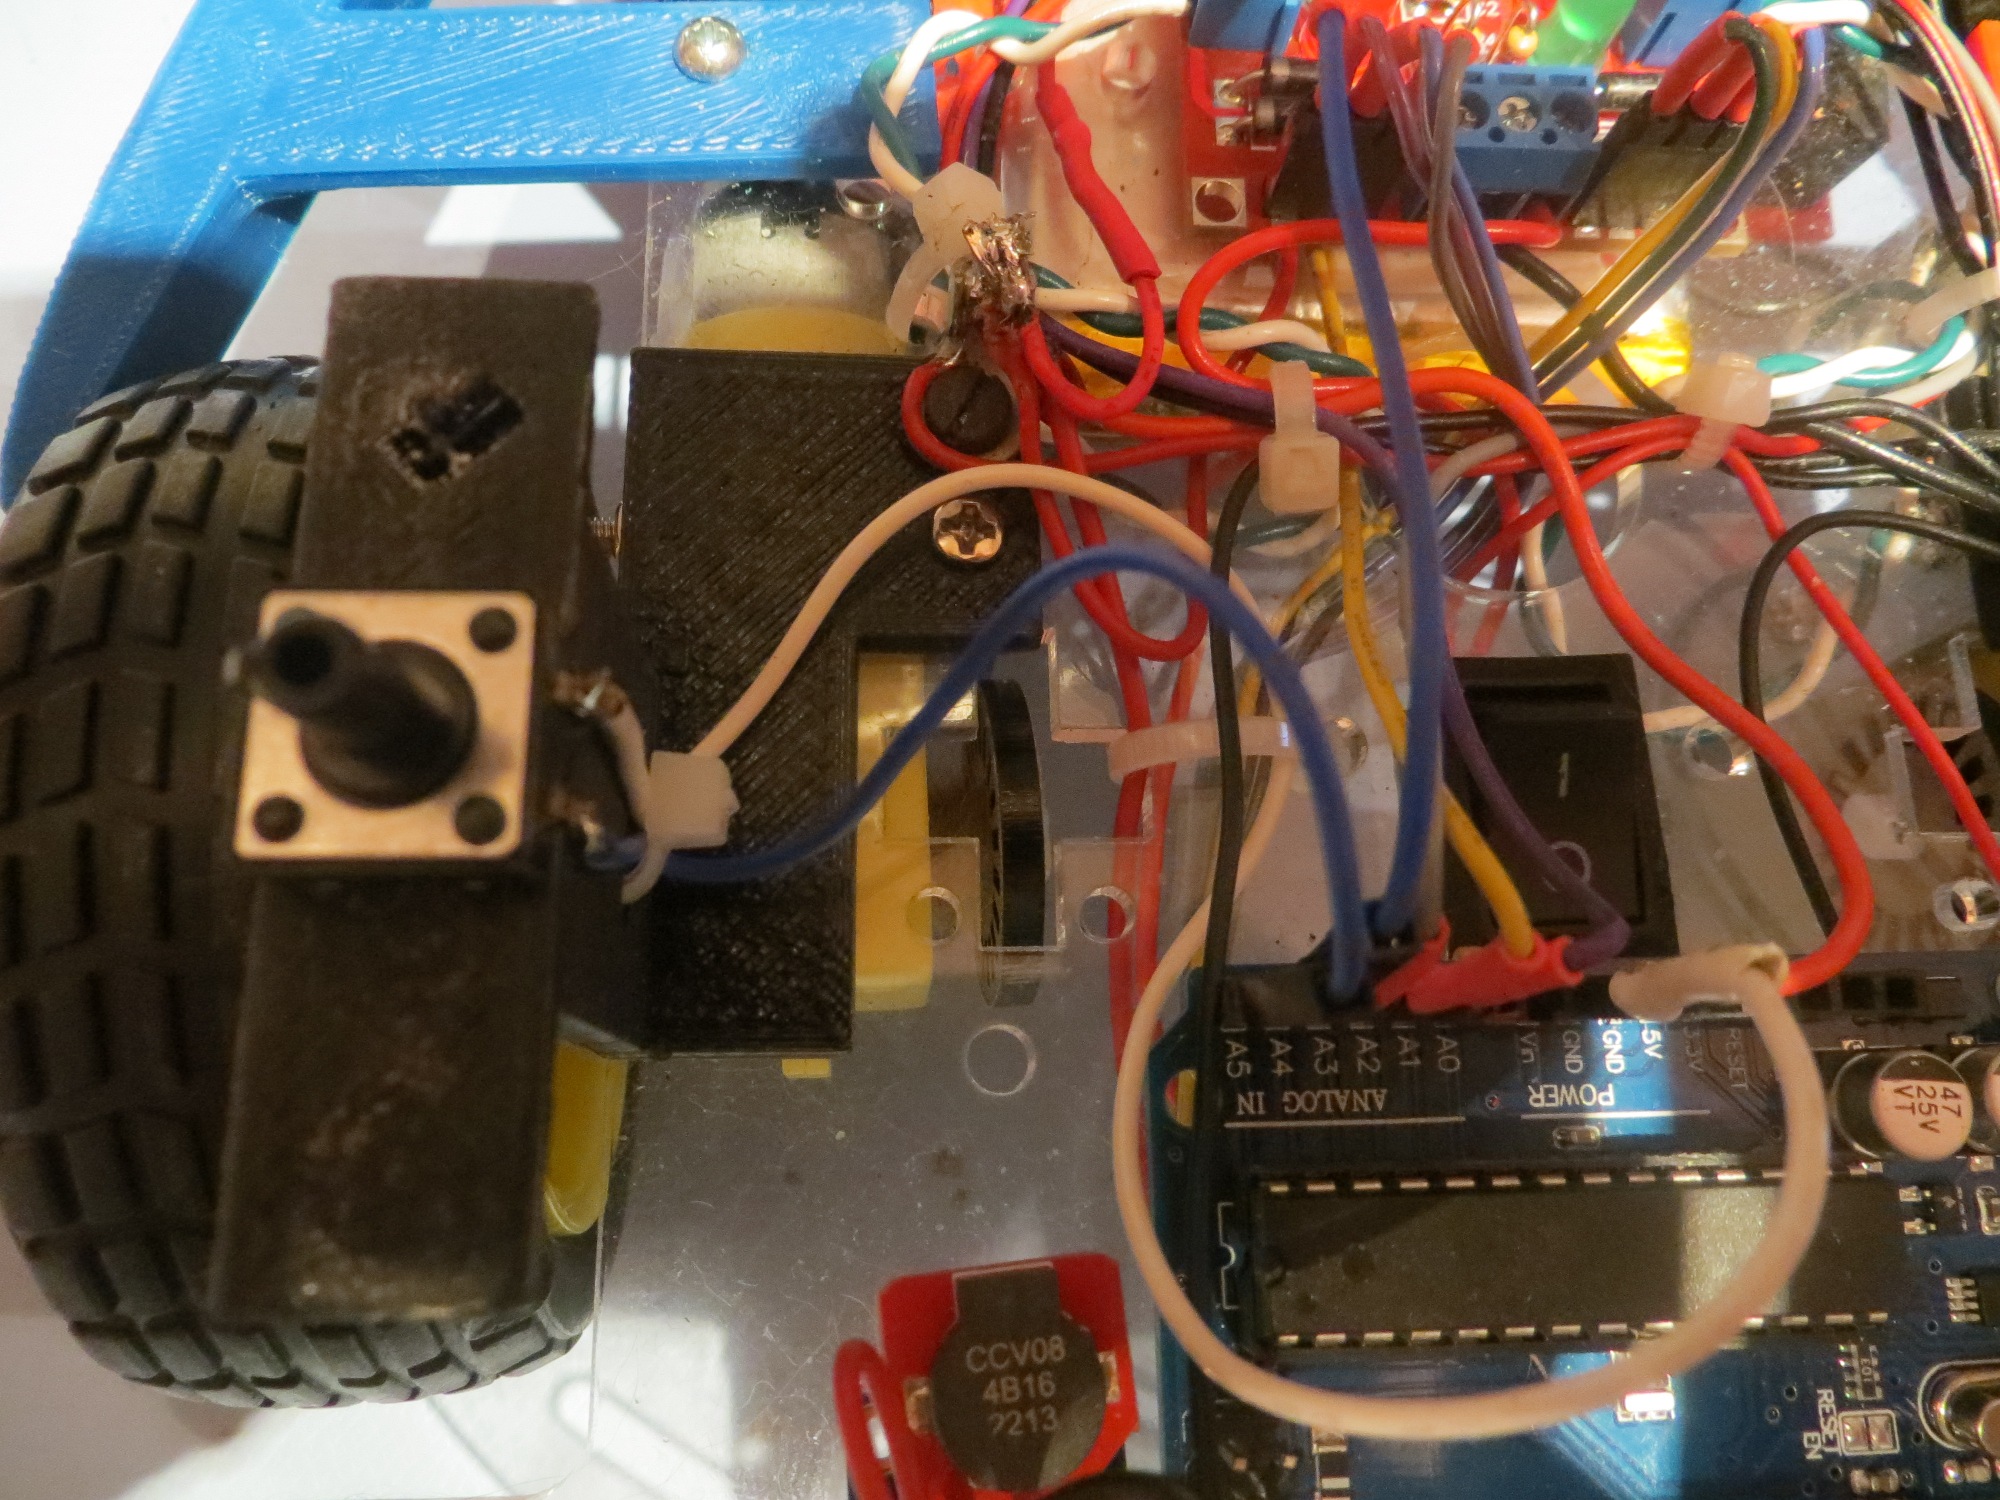
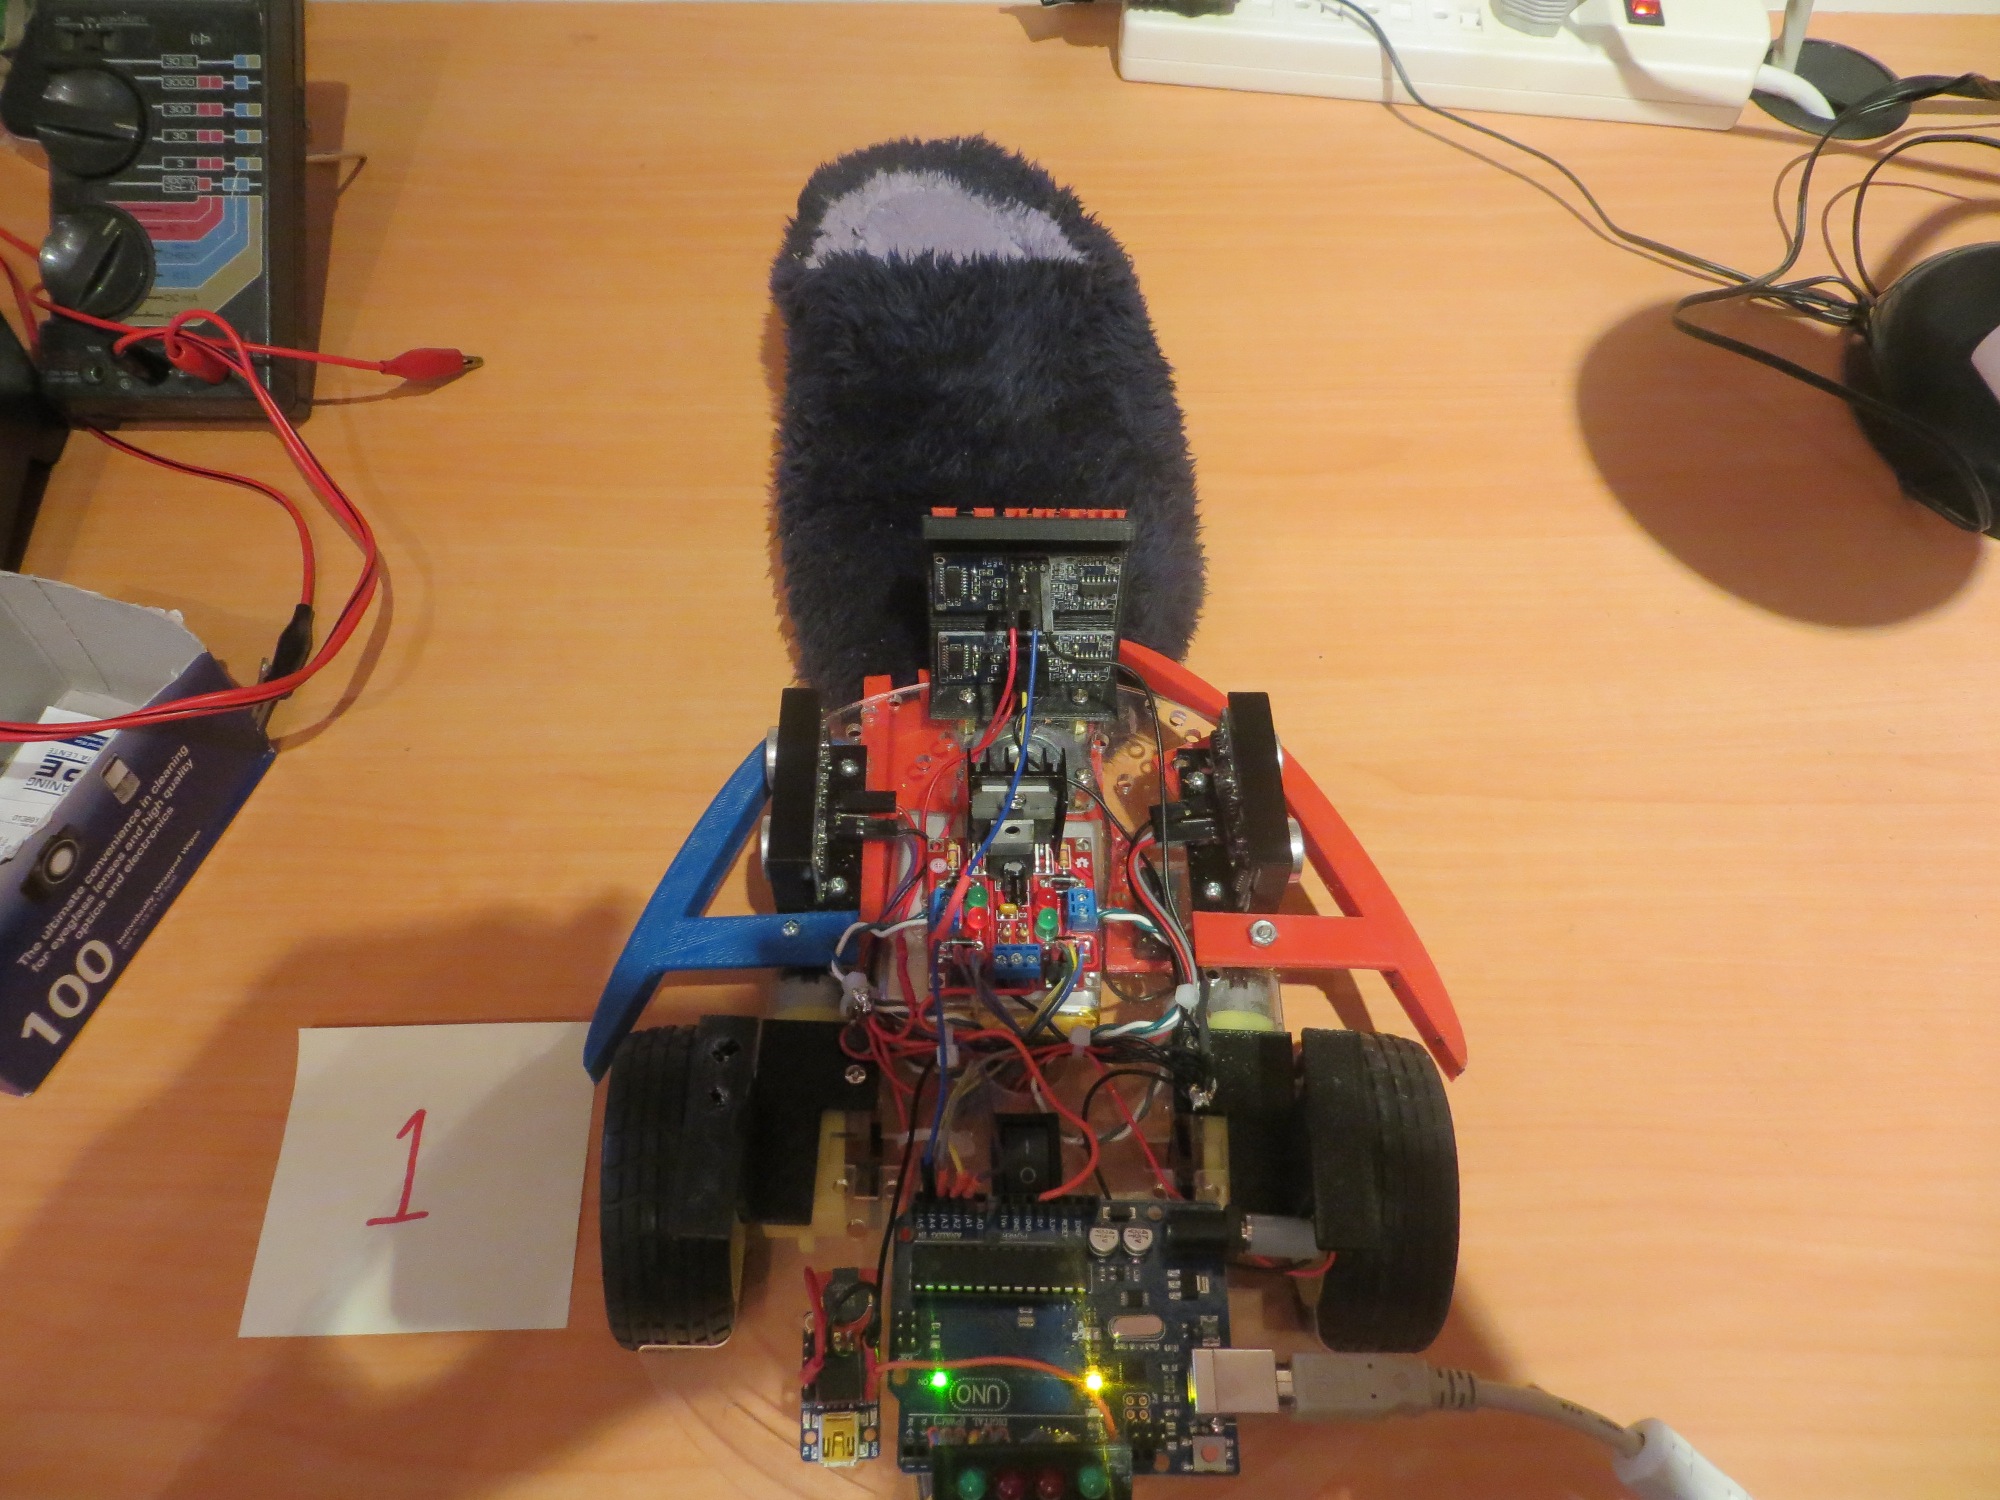
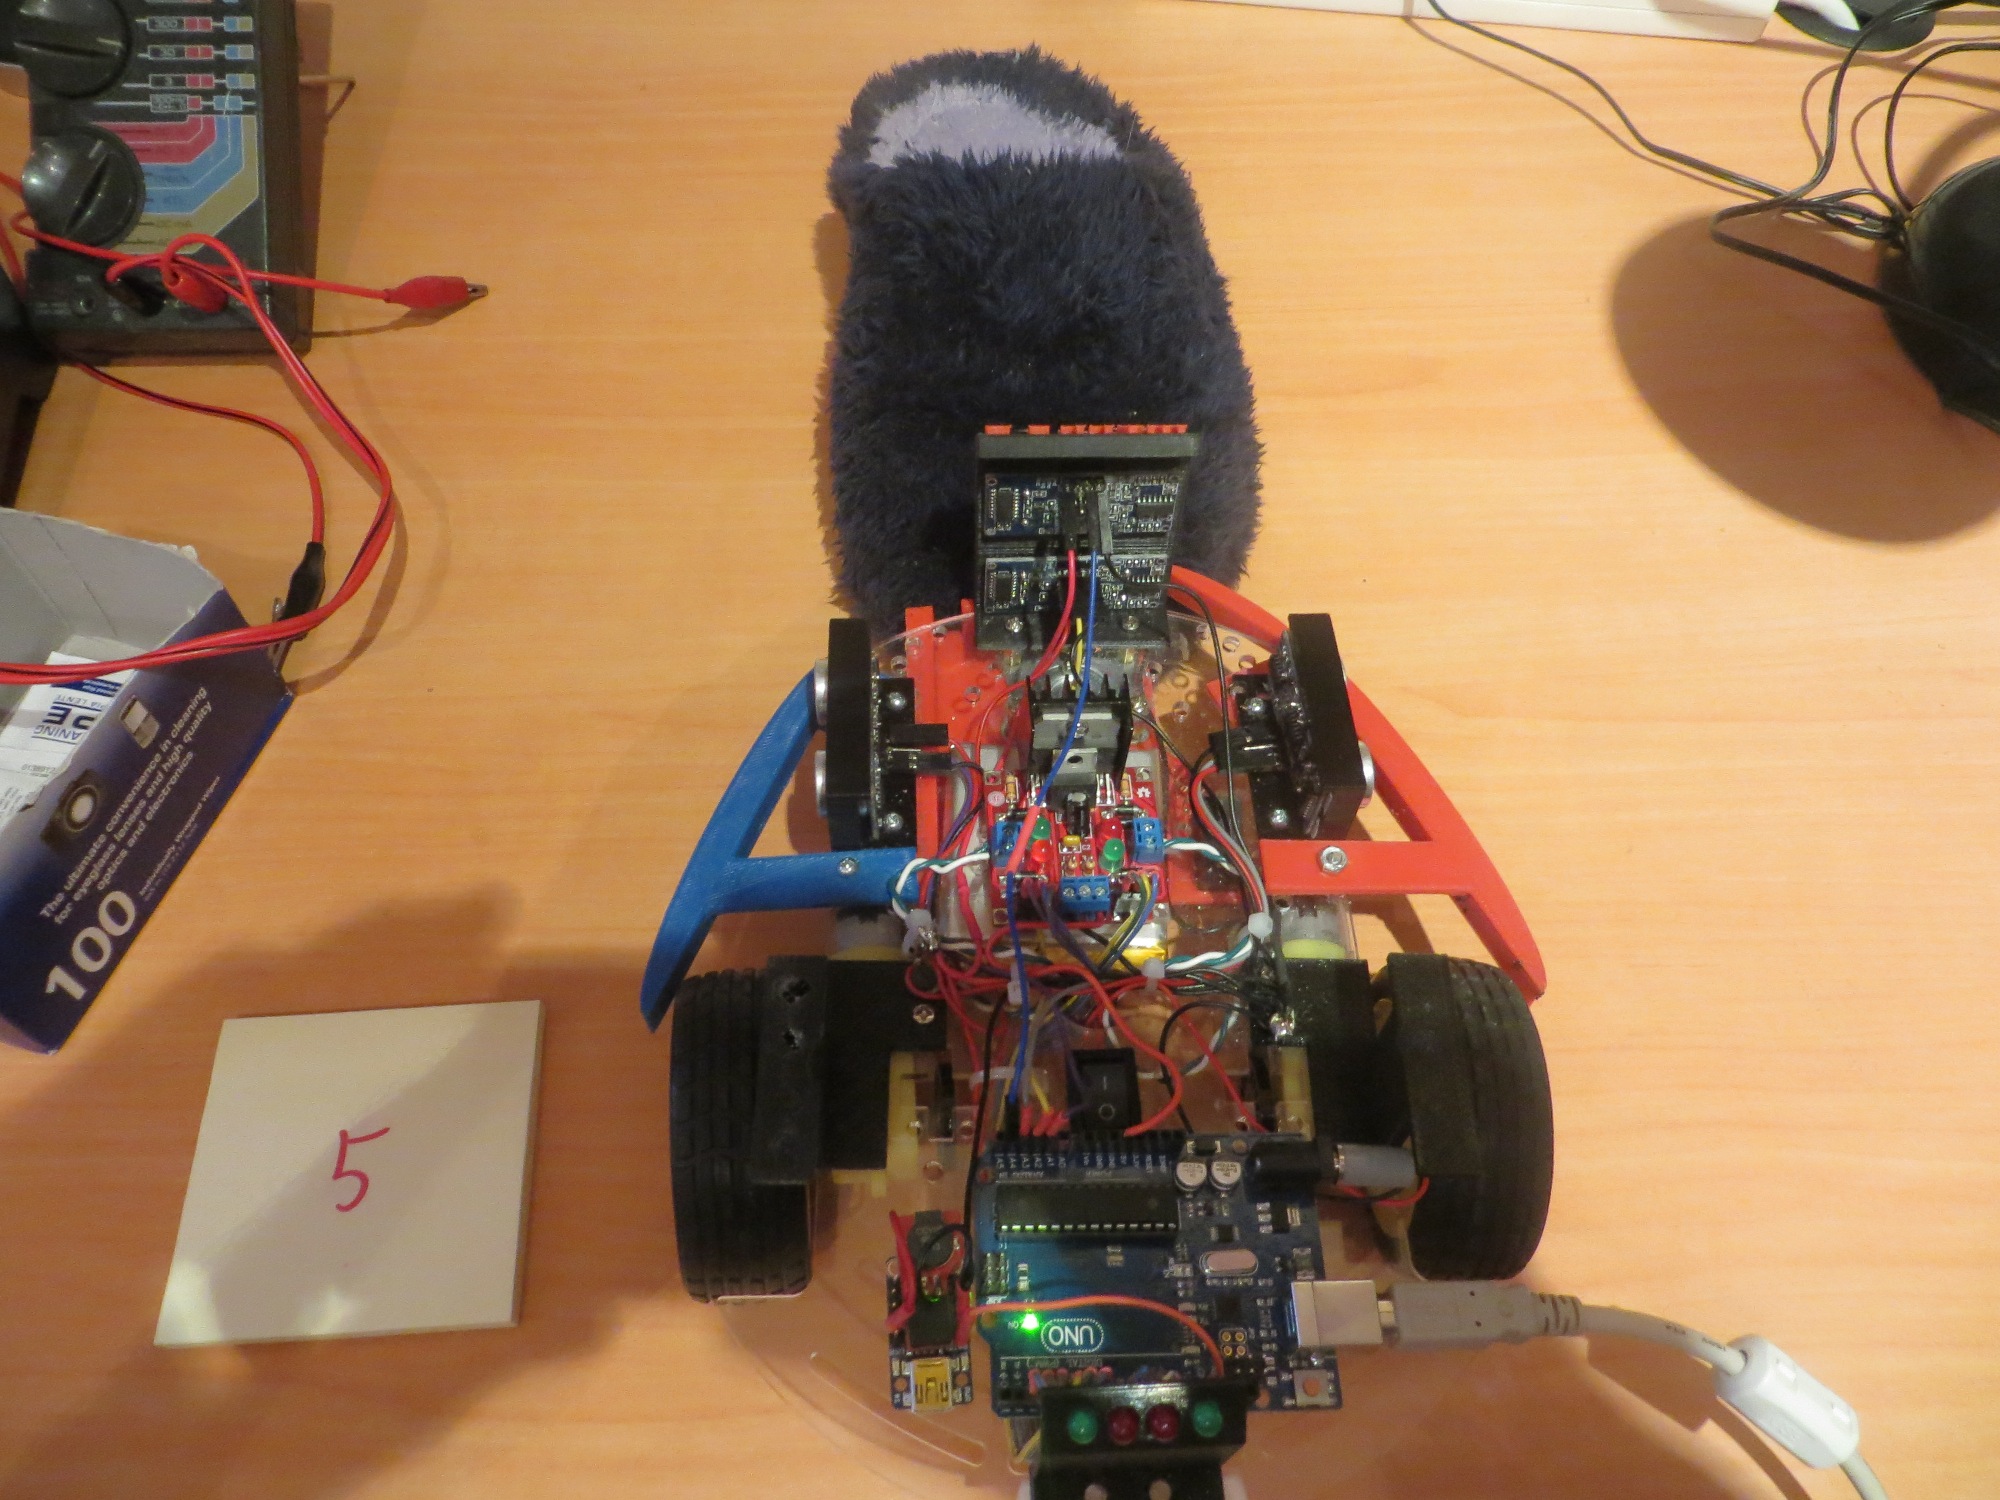
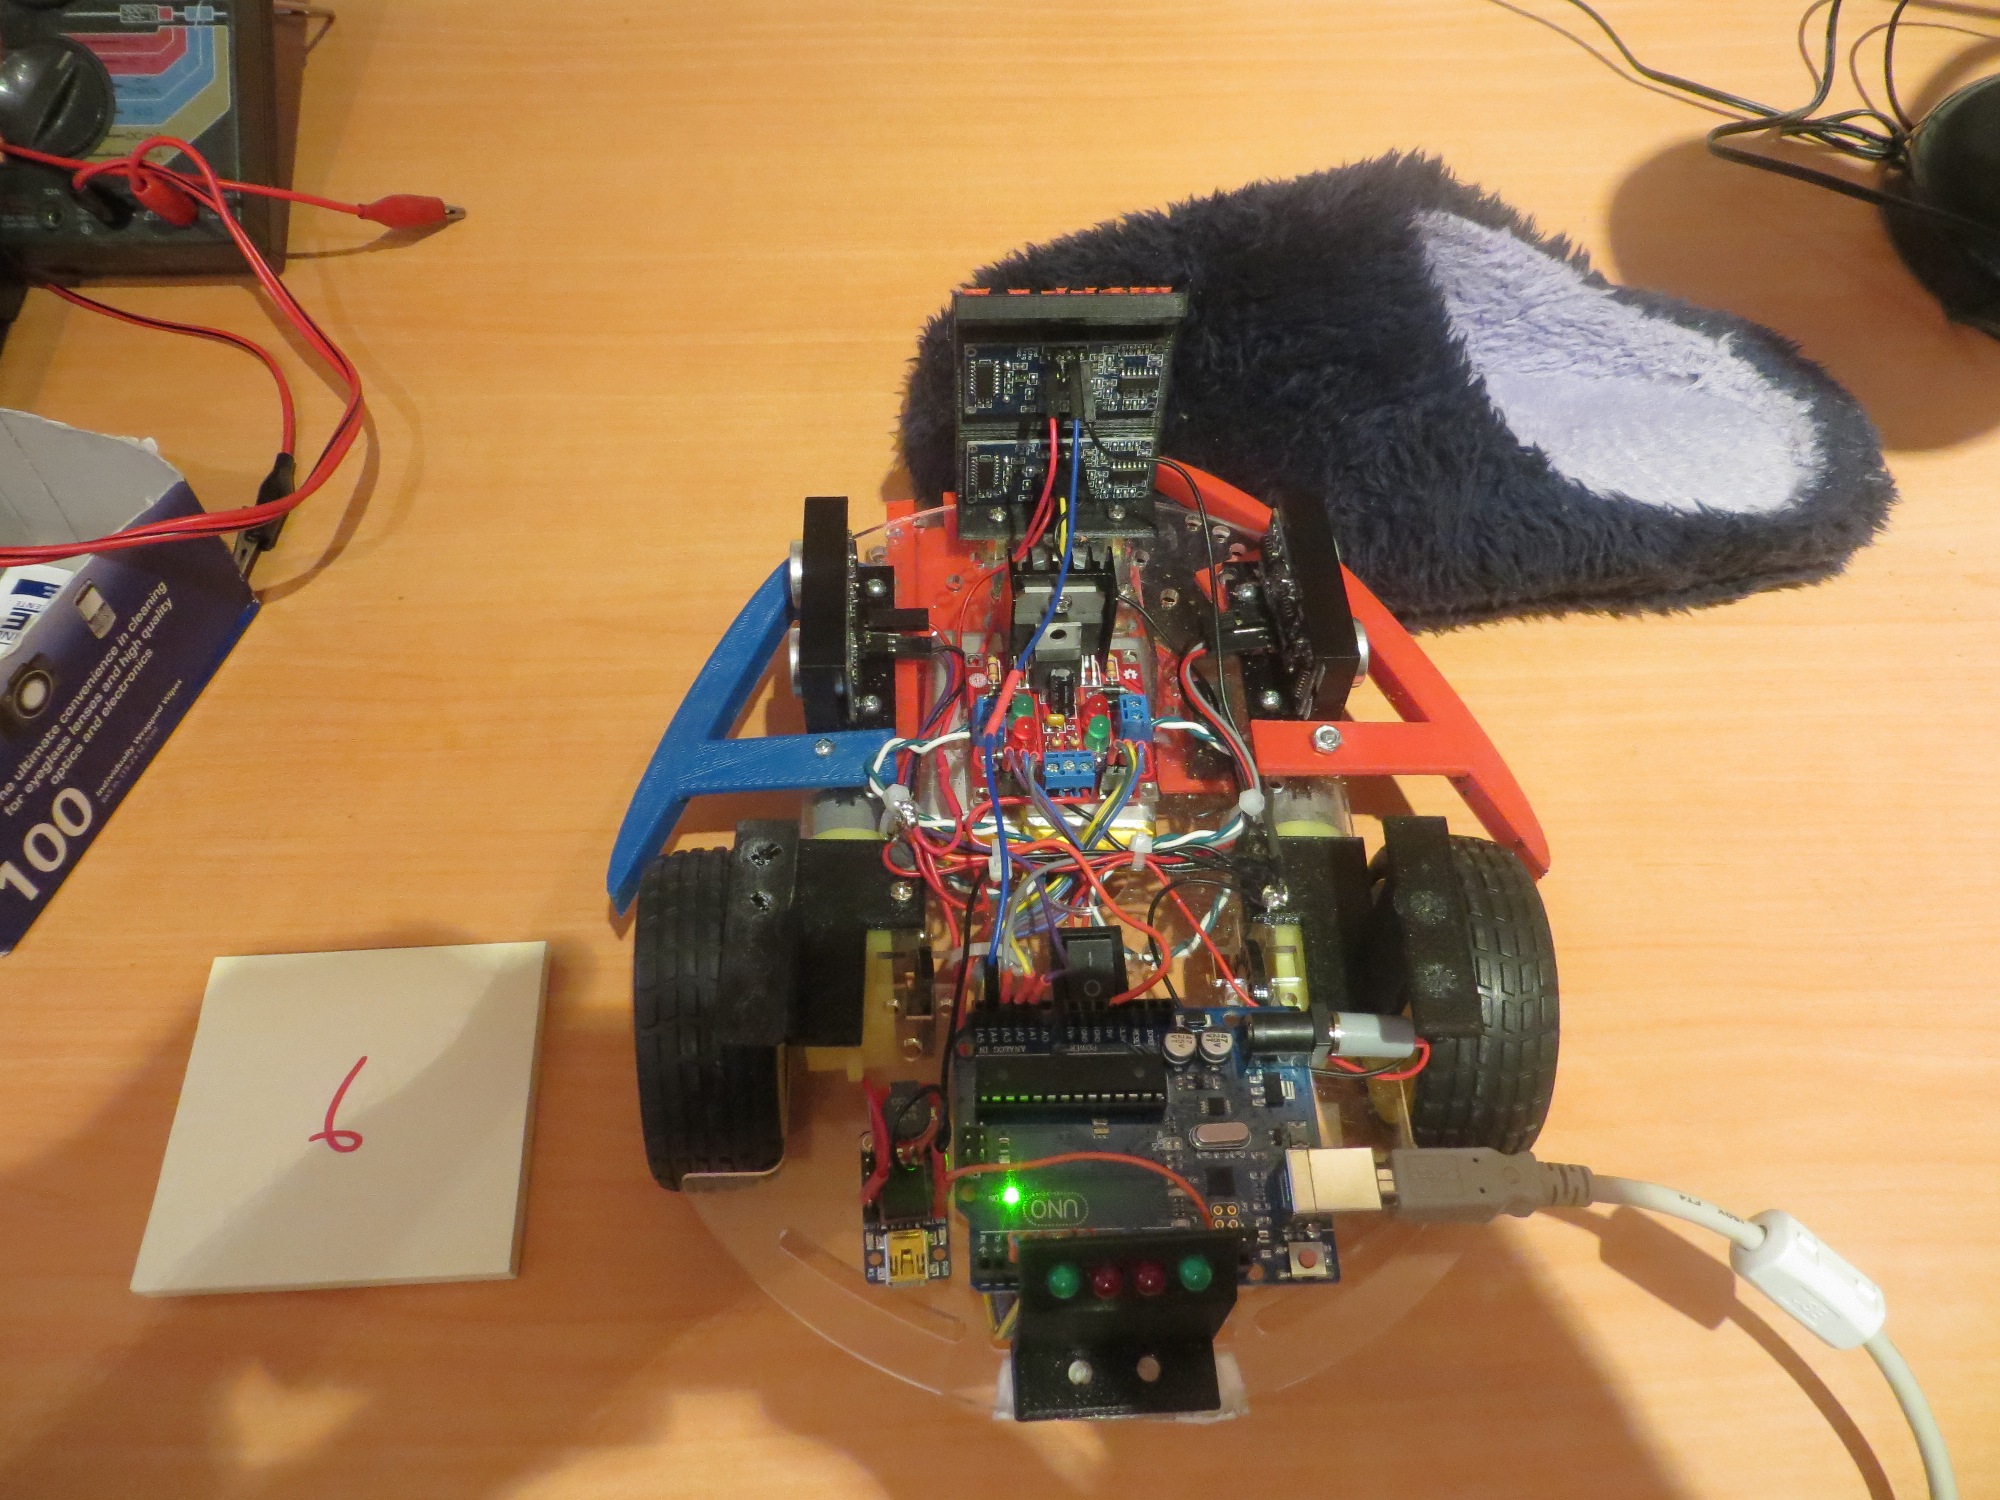
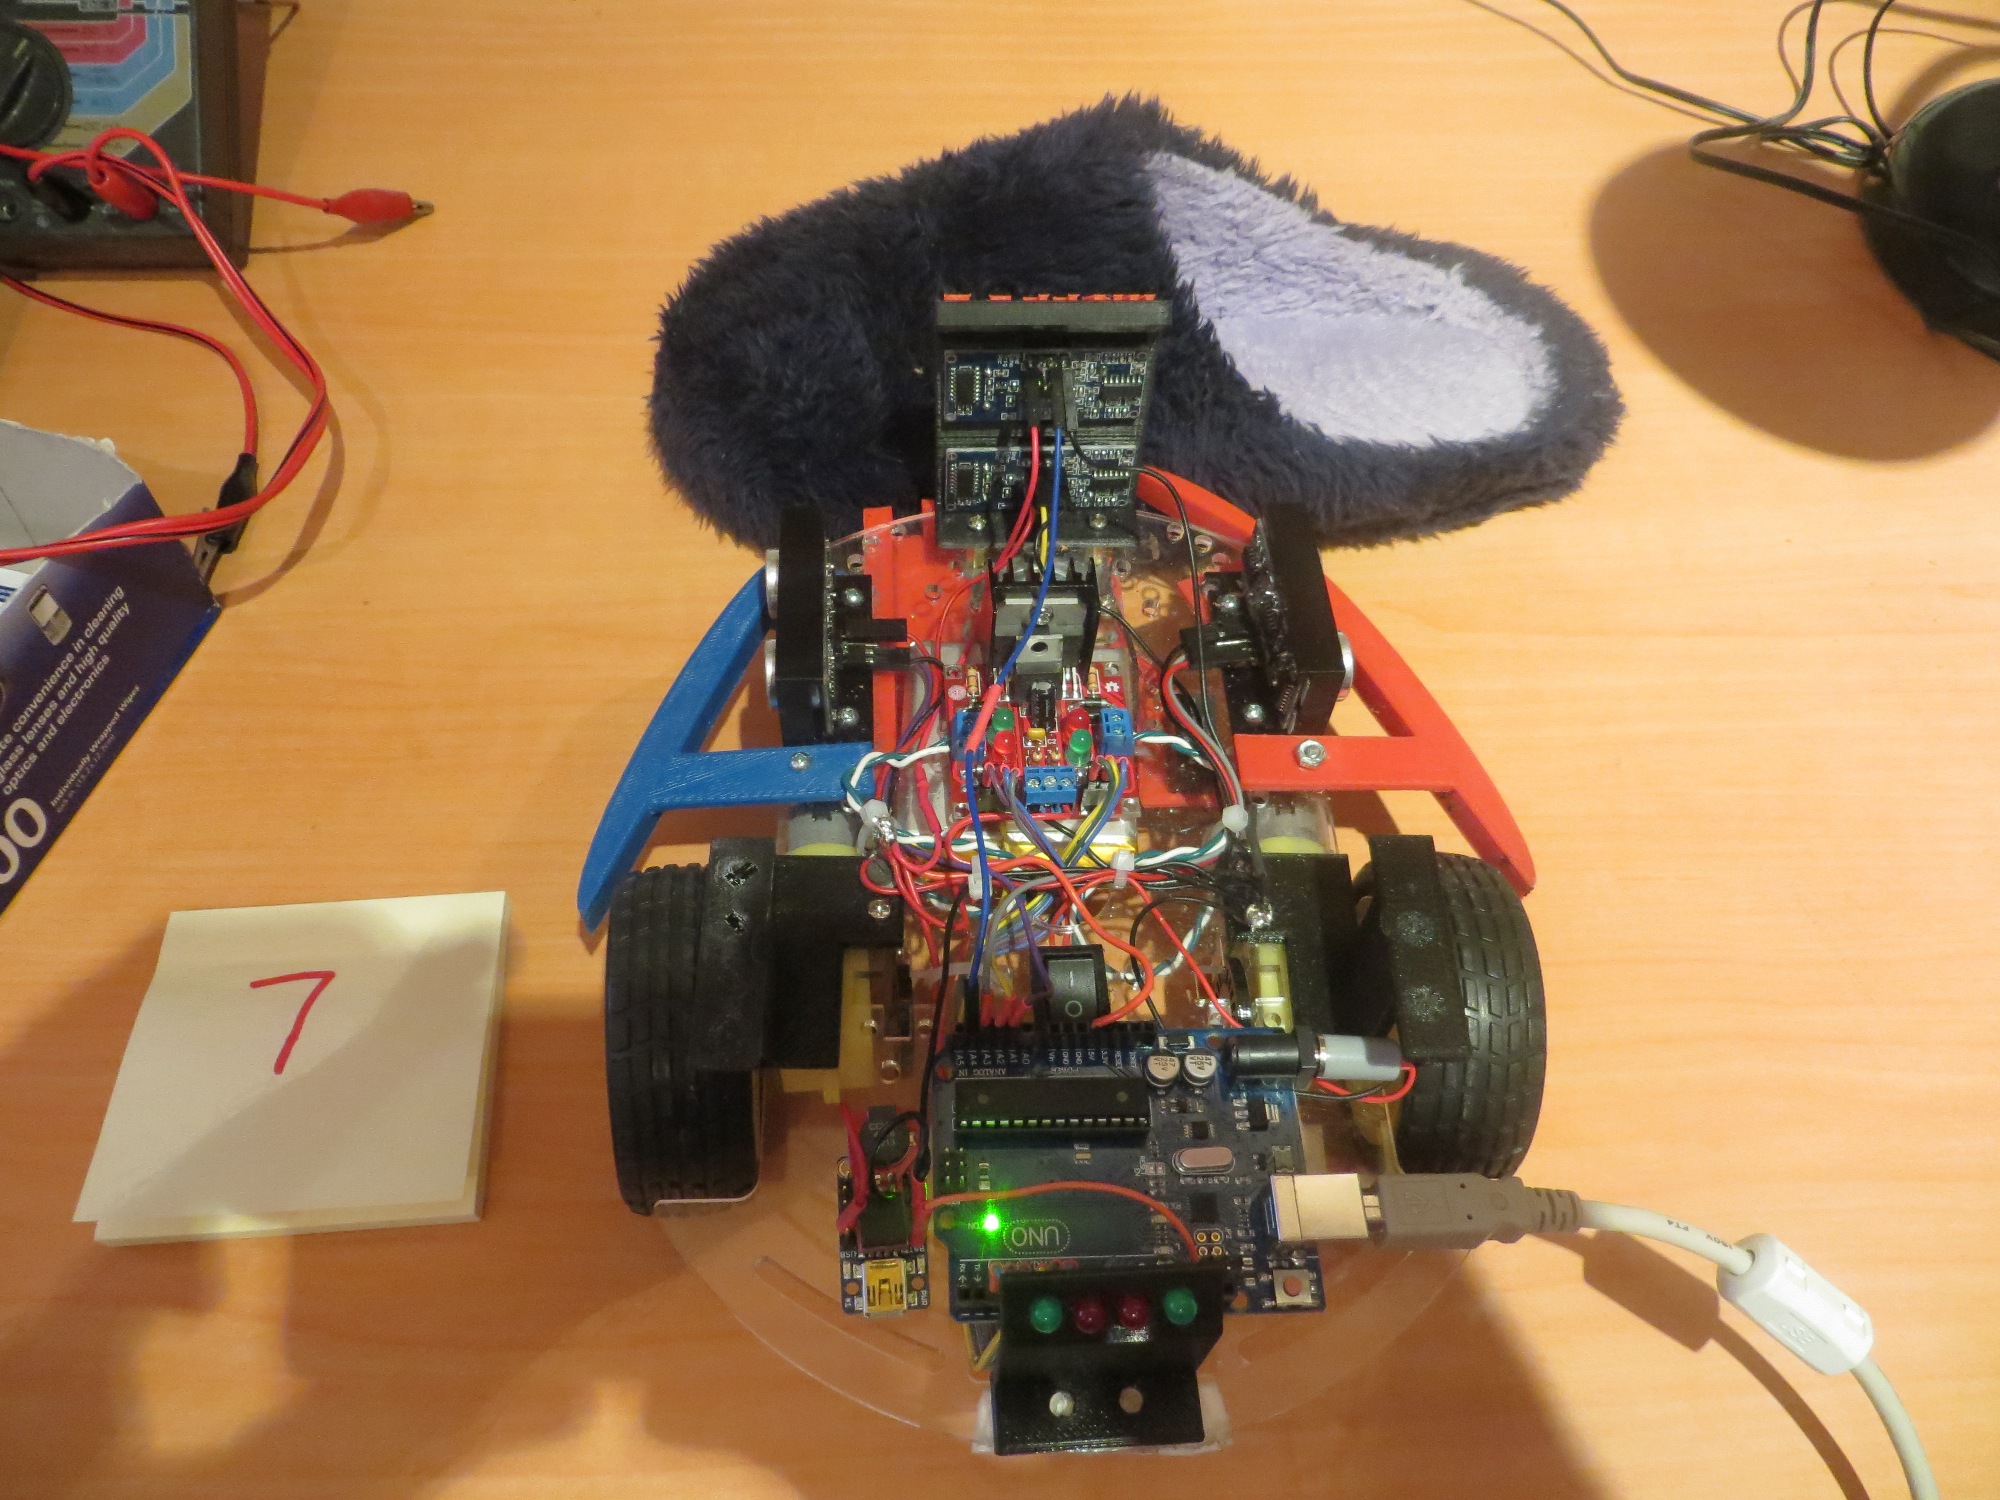
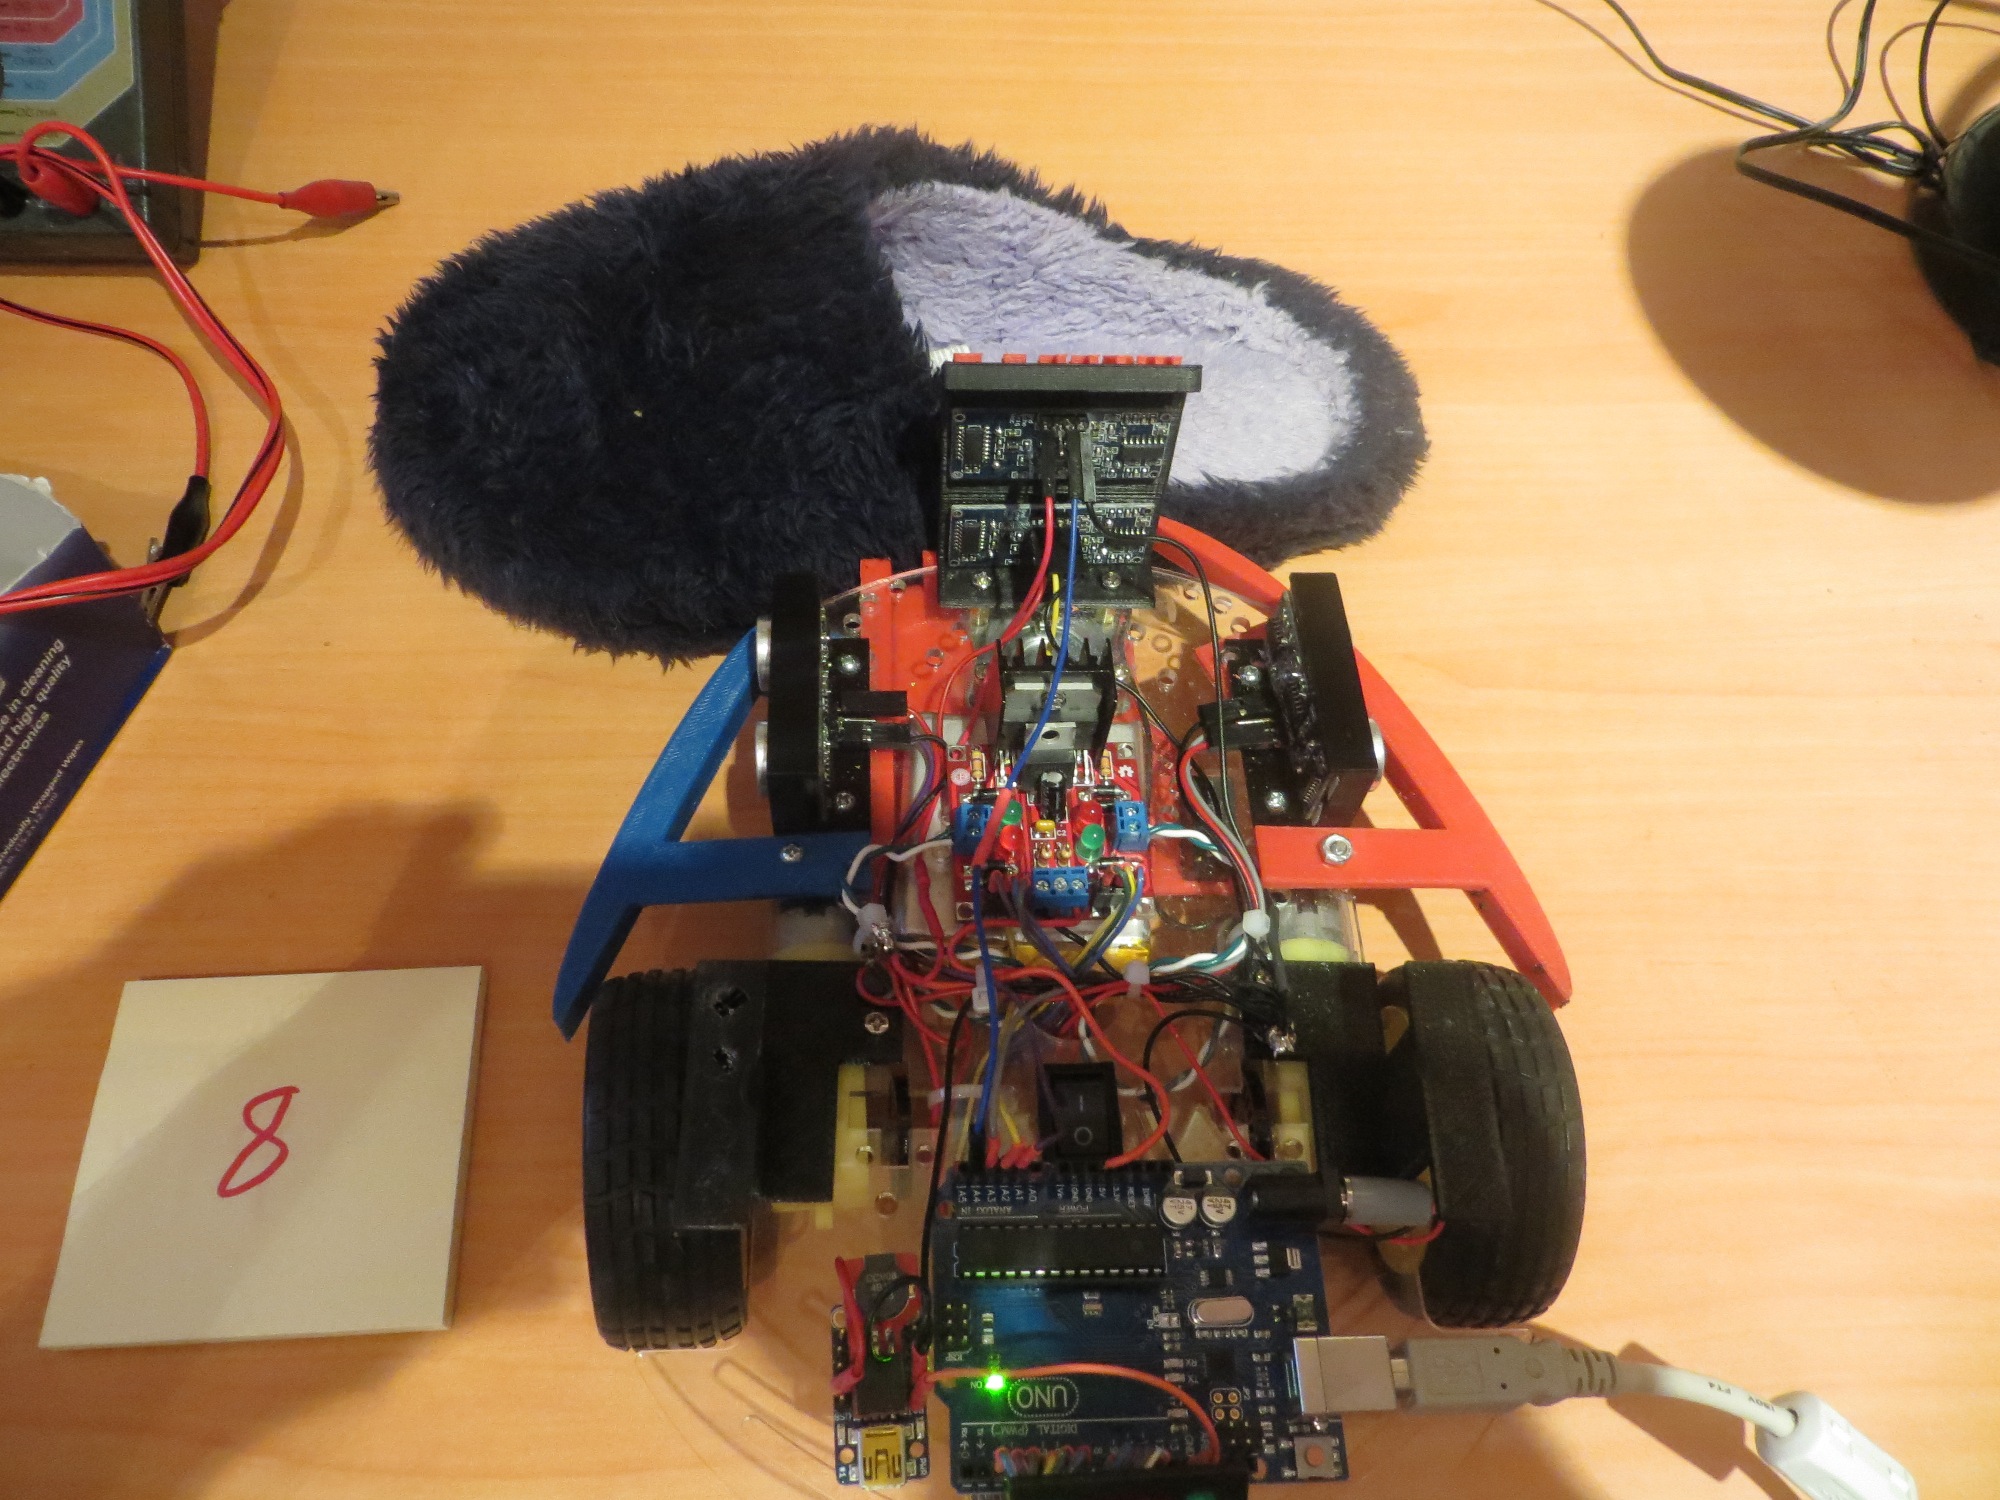
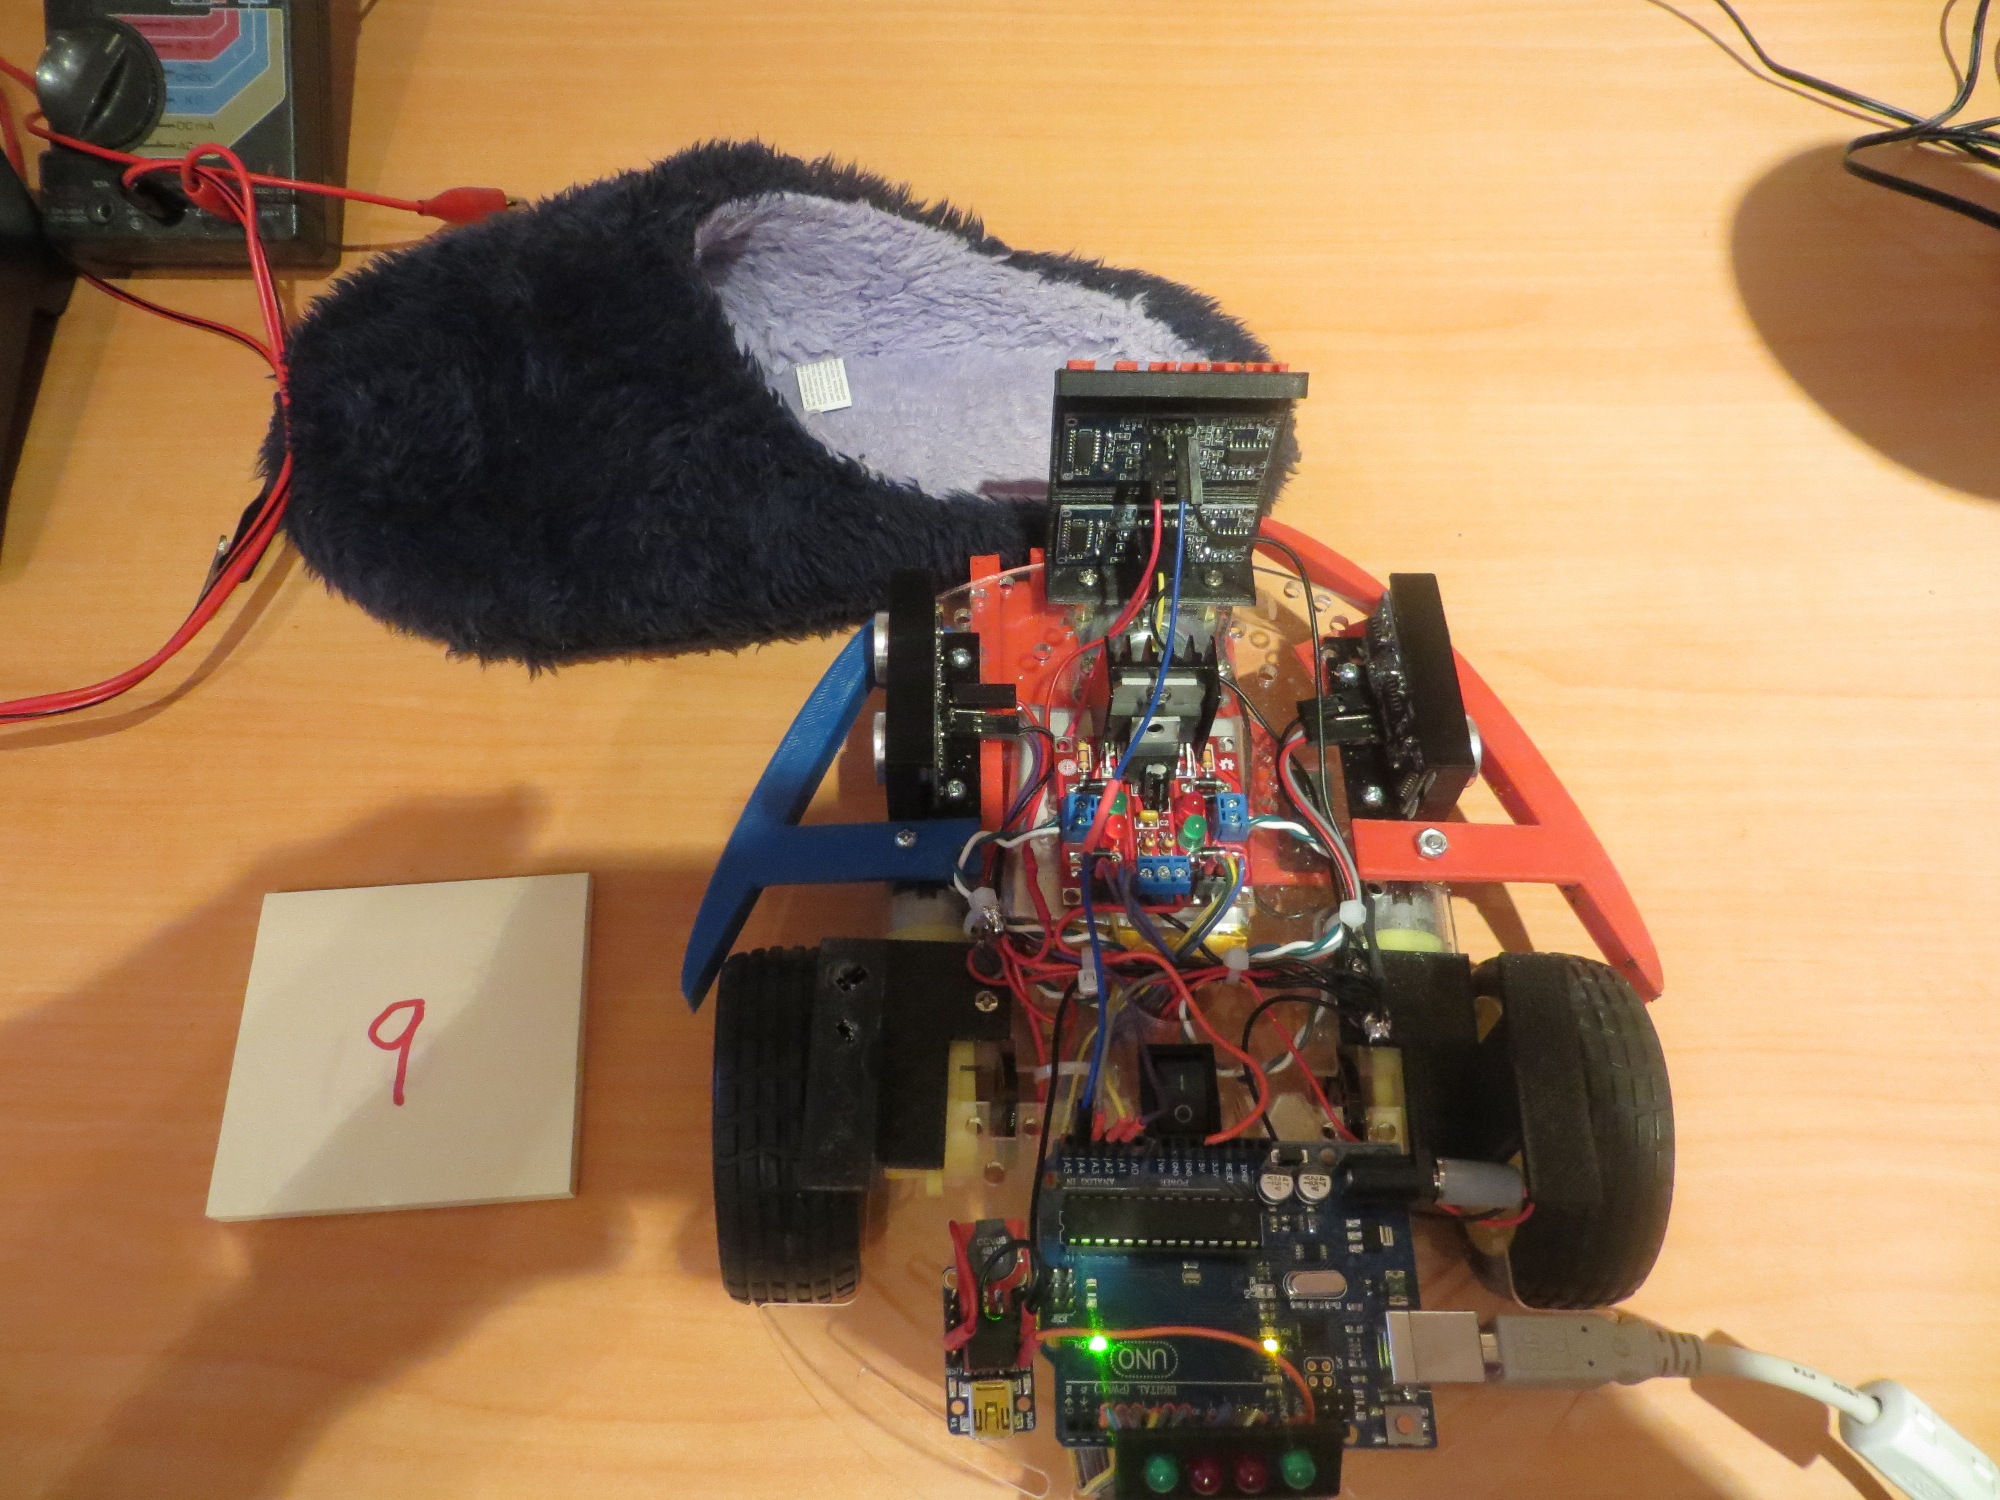
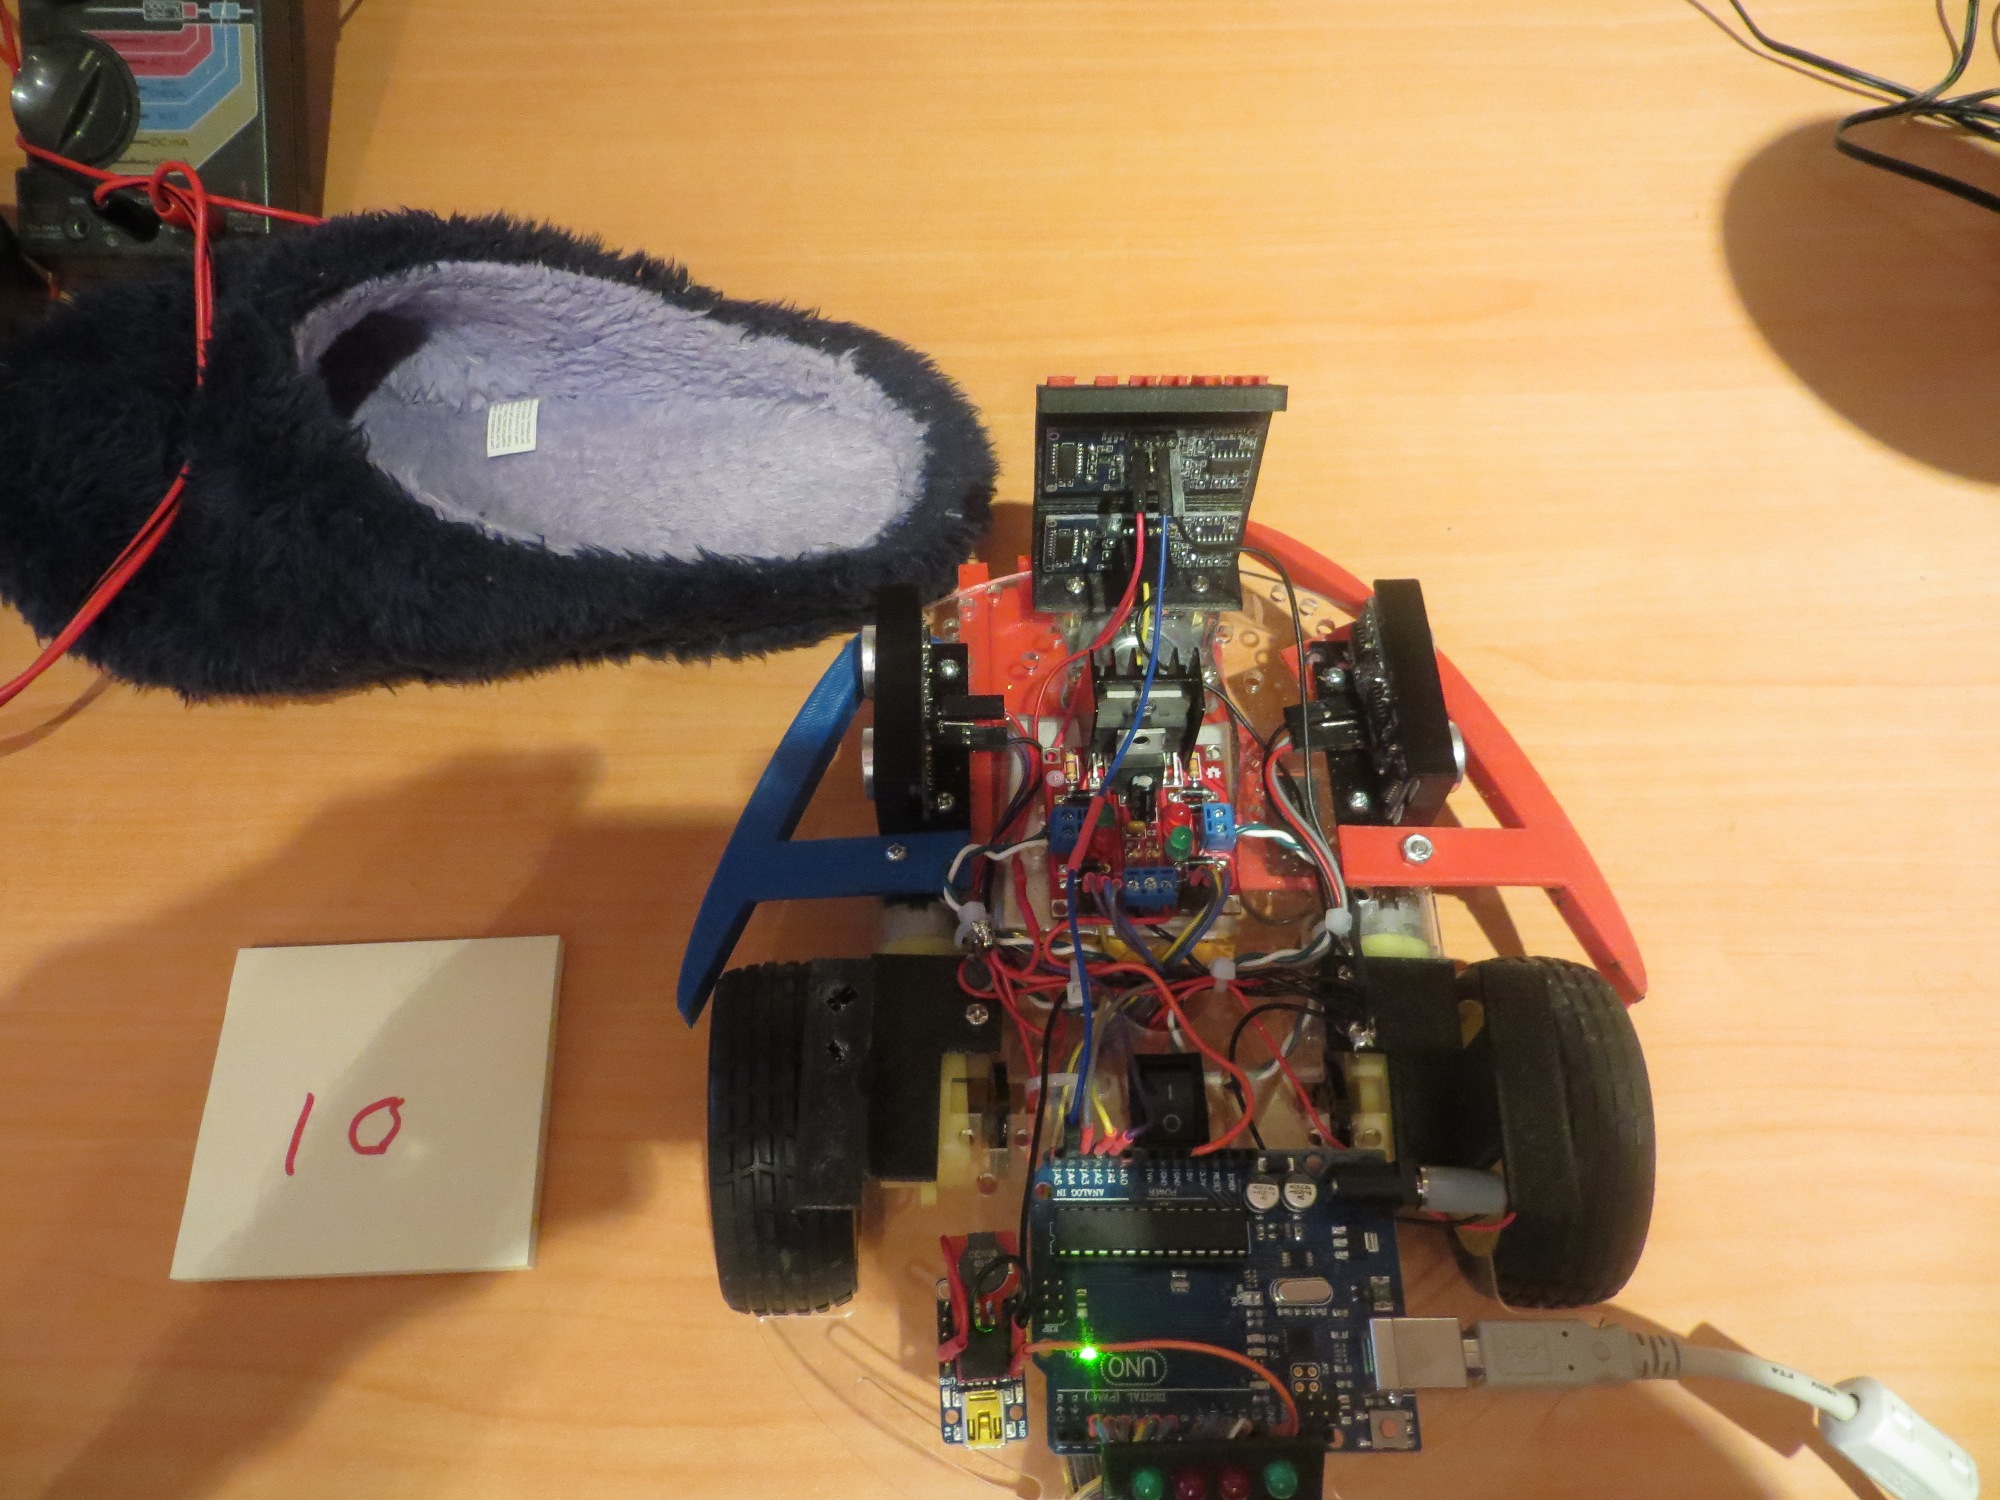
Wall-E’s right motor being used as my tachometer test bed. Note the piece of scotch tape on the wheel, used for manually timing RPM.

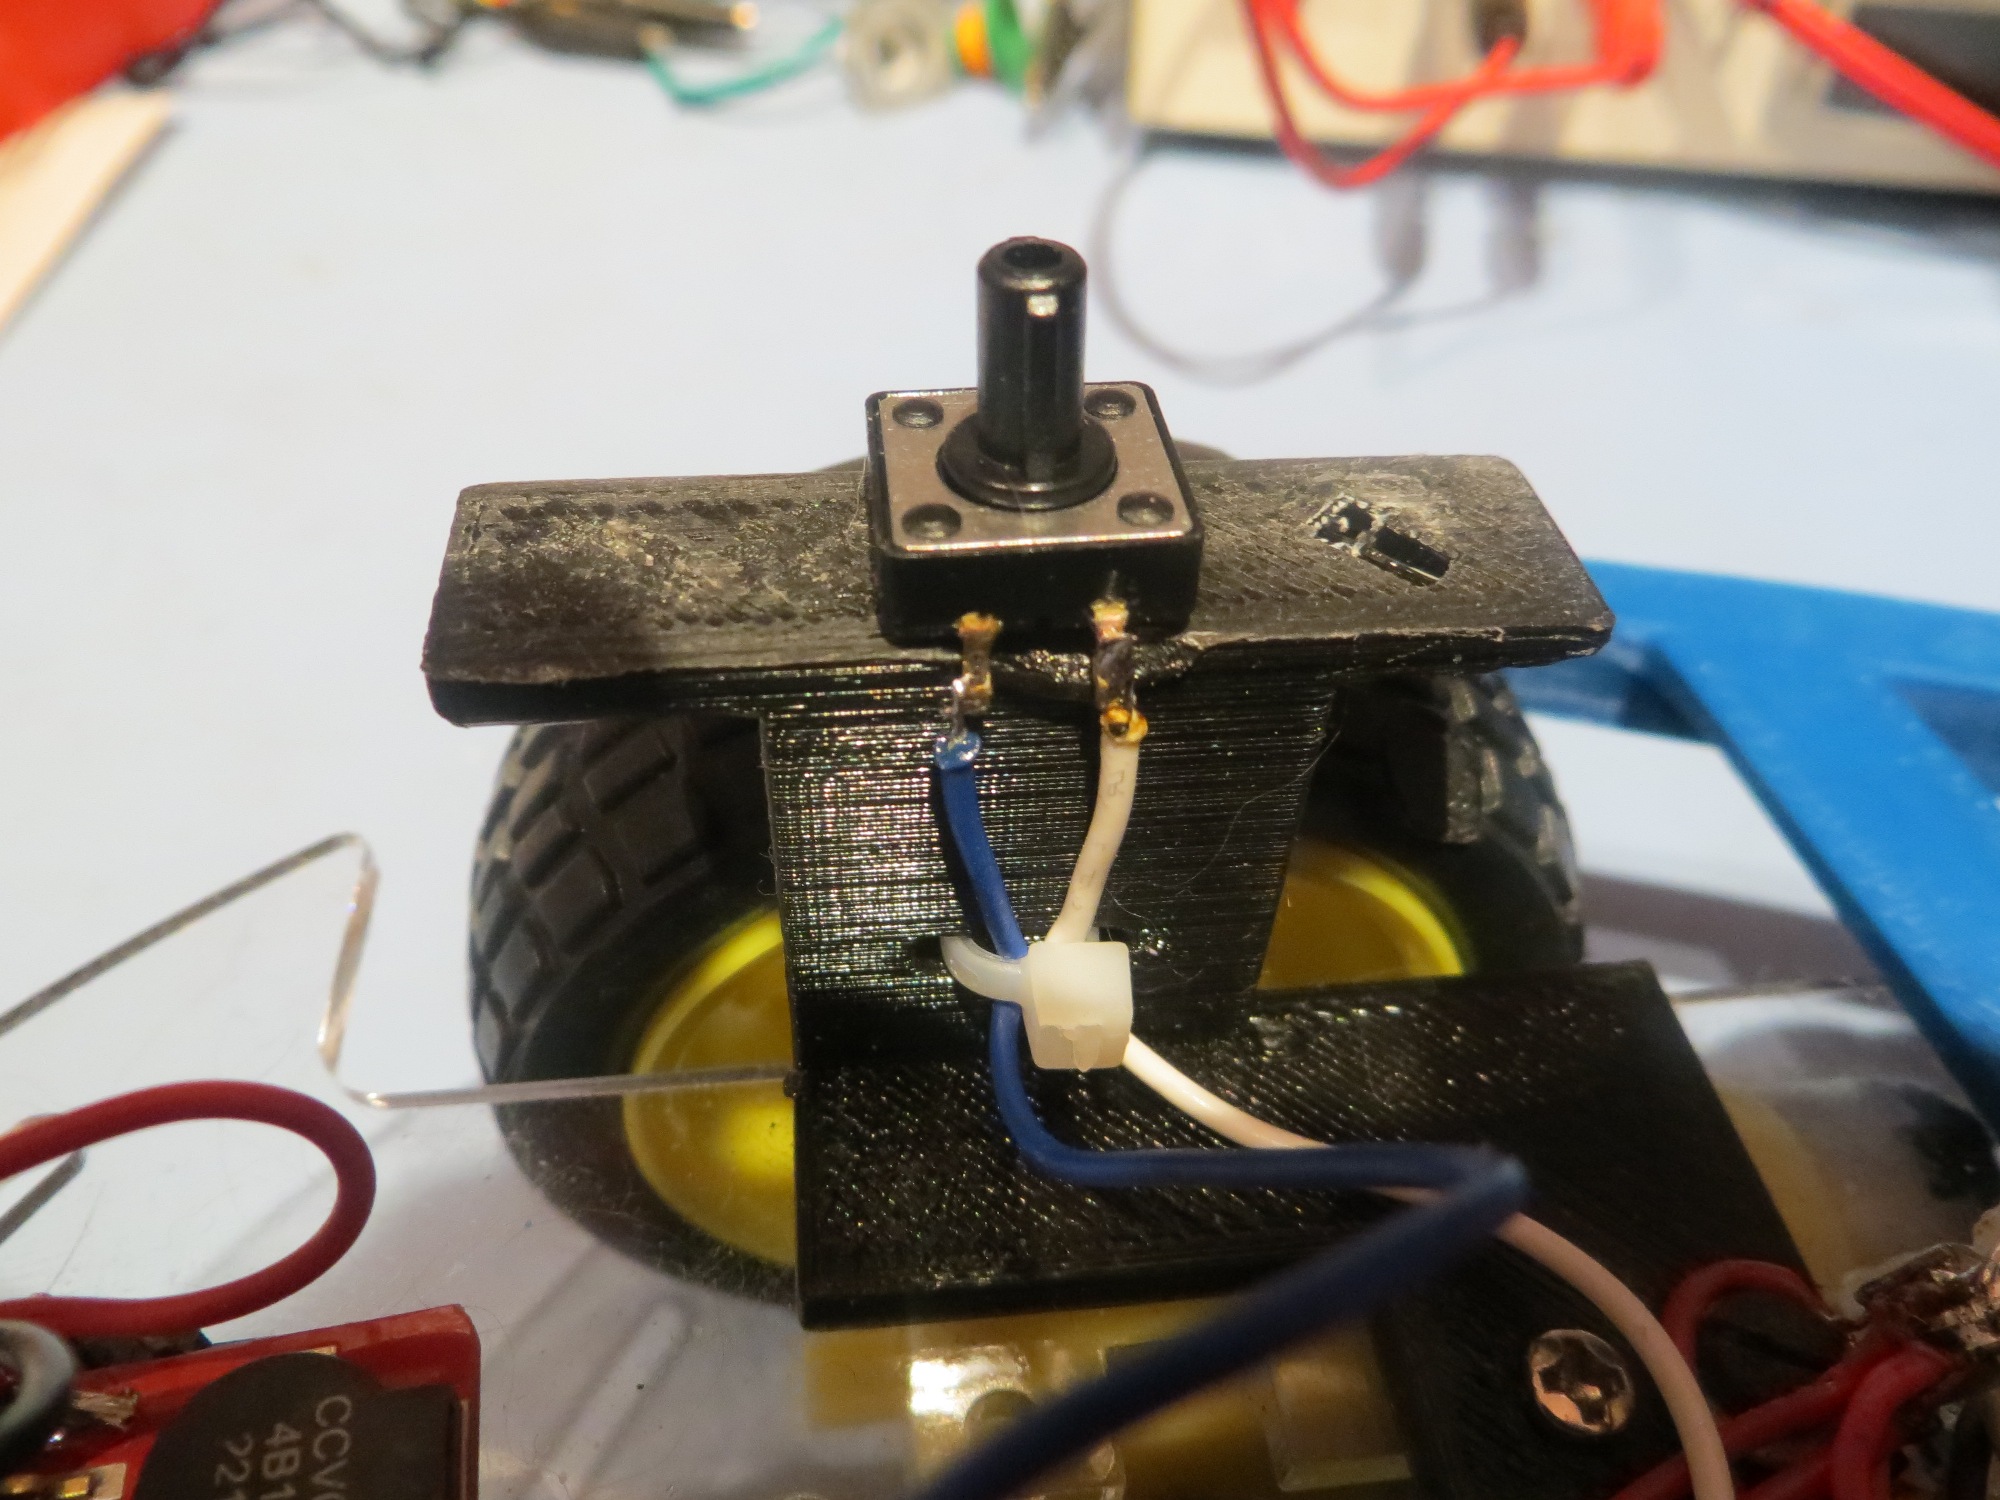
Tachometer sensor bracket, showing IR LED and tach wheel
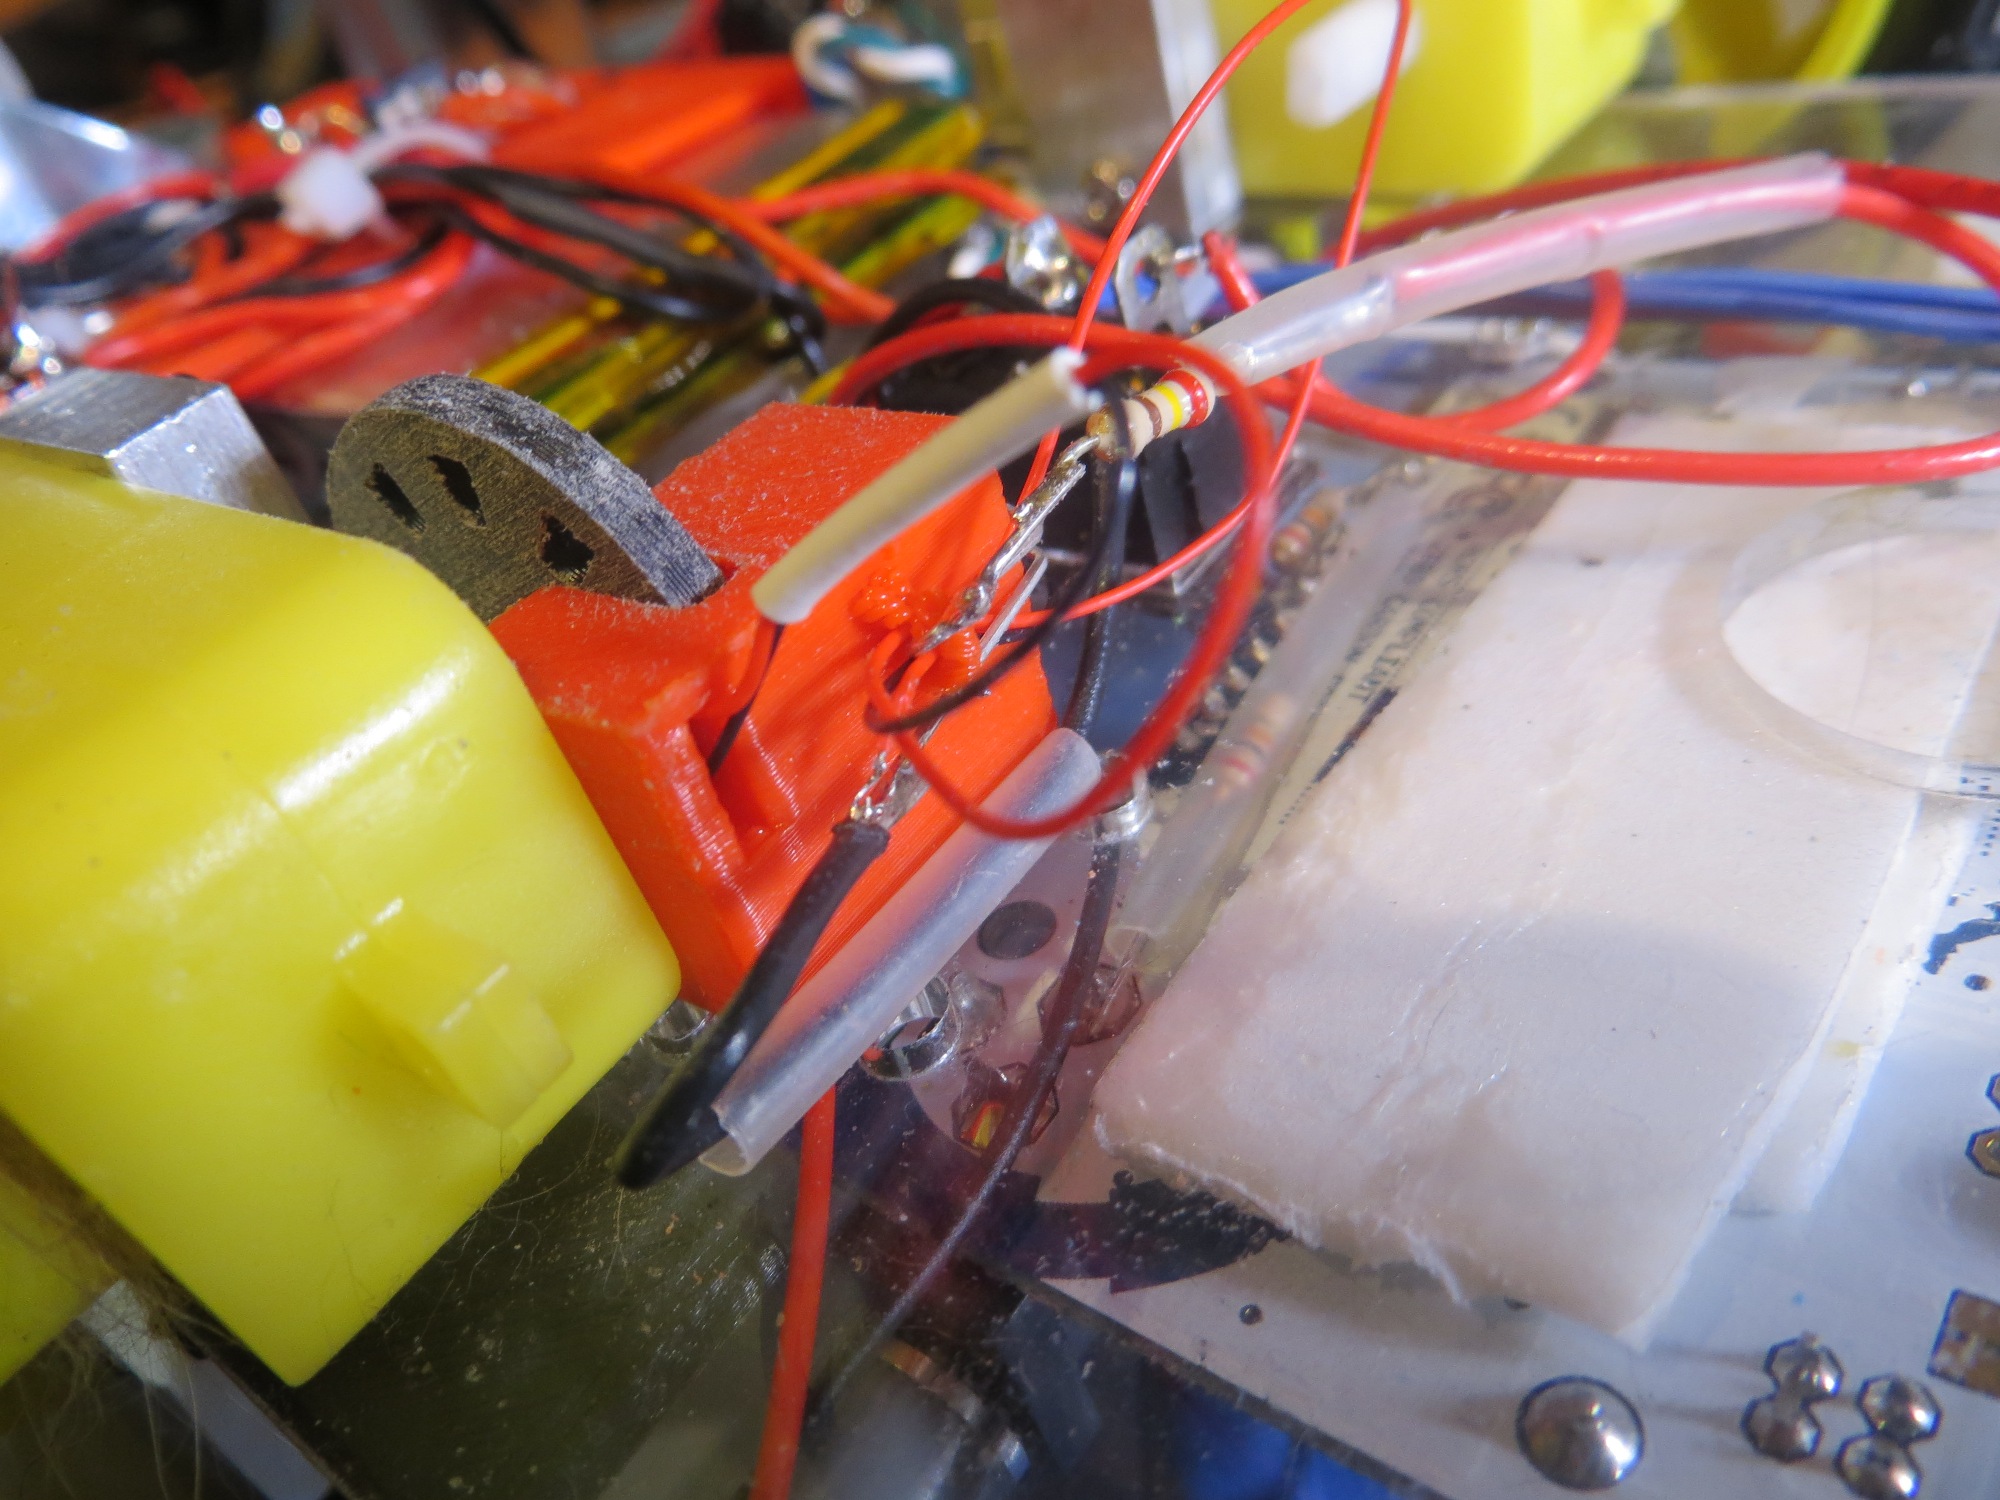
Tachometer sensor bracket, showing slot for the IR detector
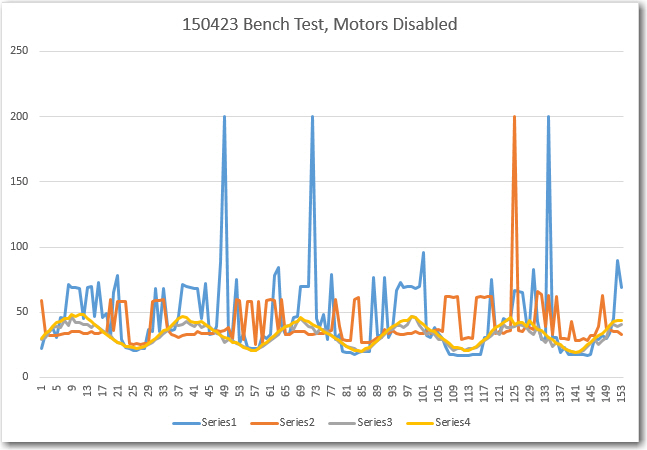
Since I was already controlling the speed of Wall-E’s motors with an Arduino Uno (albeit for steering), I simply modified the wall-following program to act as a test driver for the tach feedback system. The output of the IR detector was connected to an analog input, and the analog readings were captured and imported into an Excel spreadsheet for analysis.
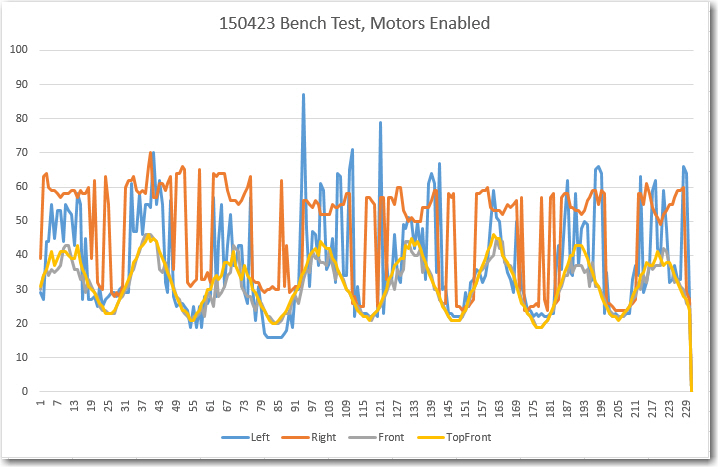
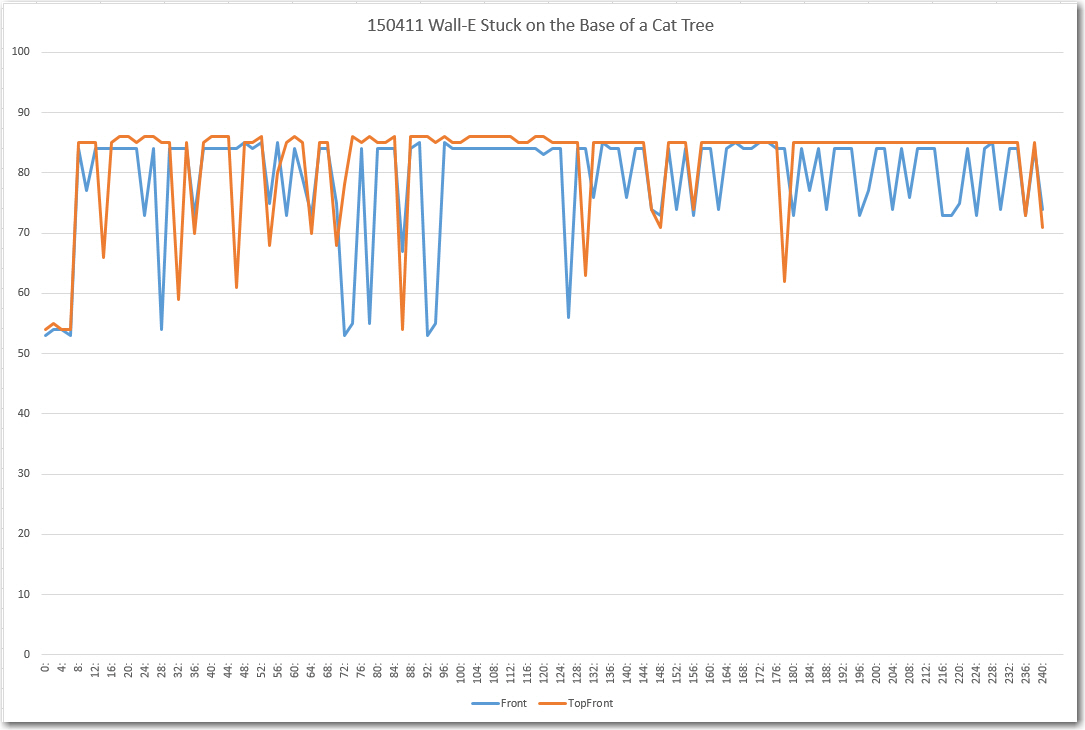
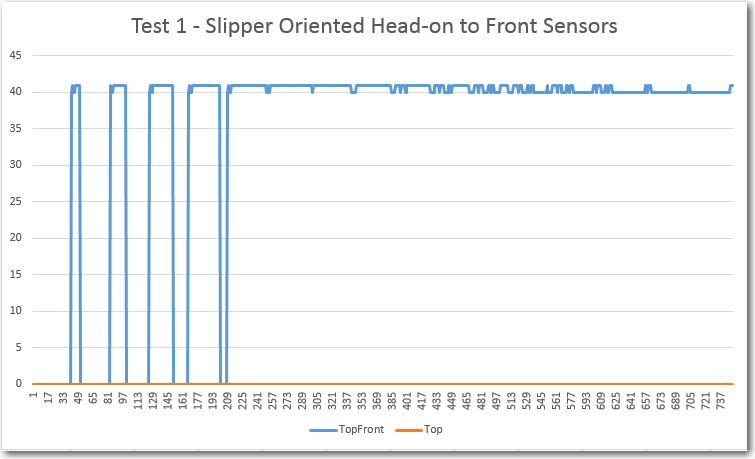
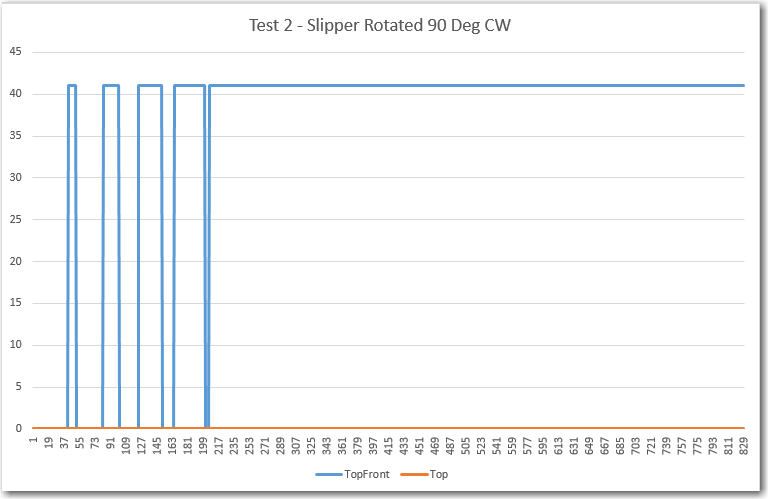
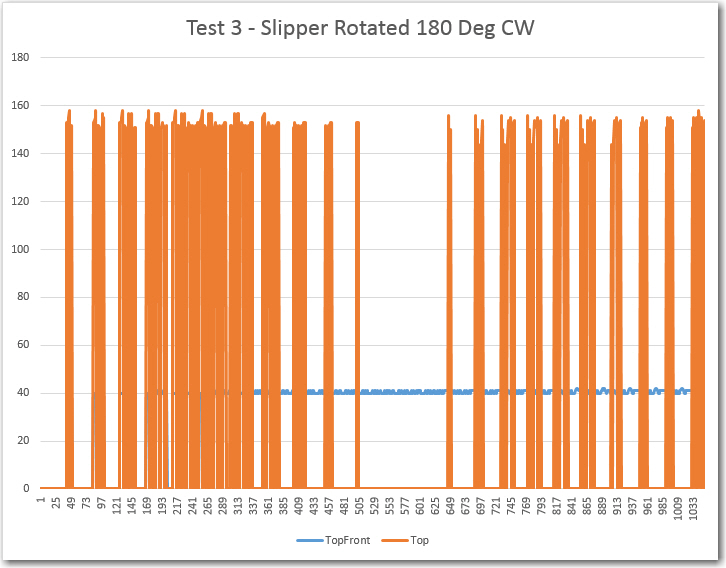
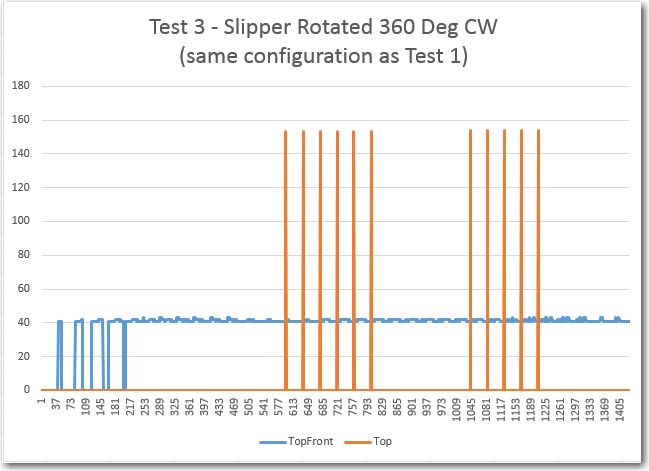
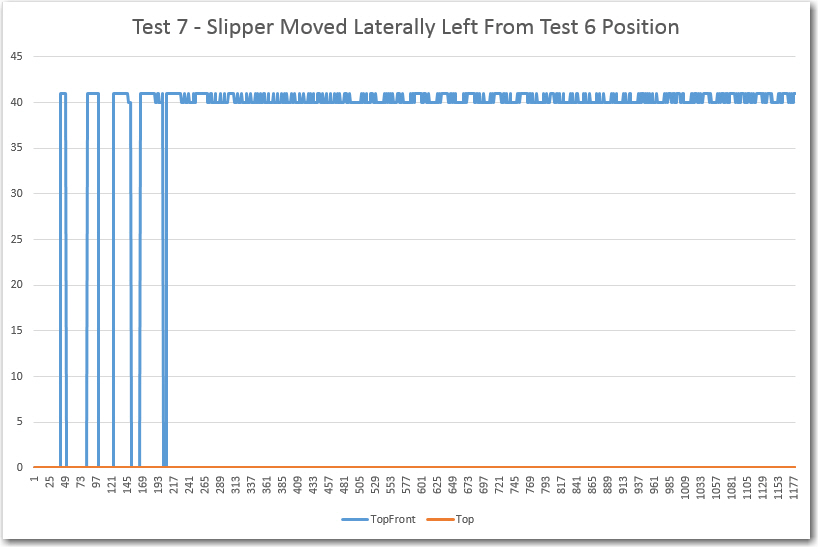
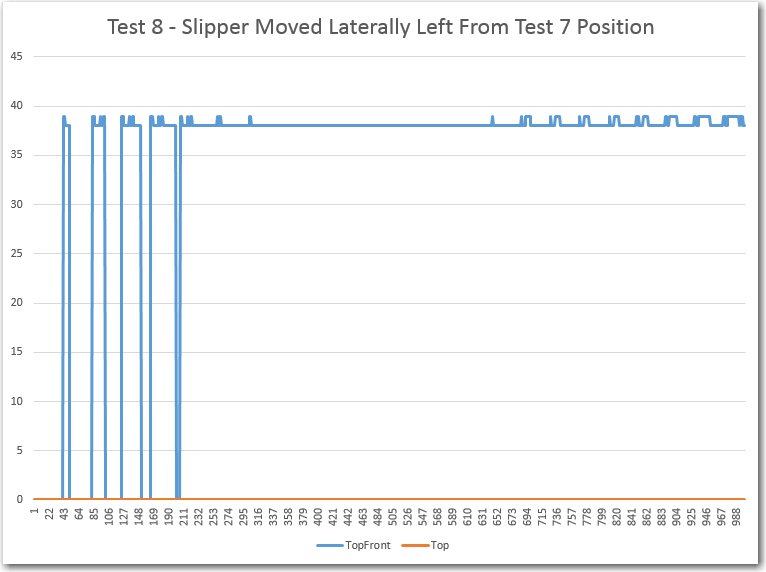
The first test showed that I wasn’t getting enough signal swing between the slot and non-slot (plug) states of the tach wheel (less than 100 out of a possible 1024 levels), and this led me to start experimenting with different IR detector apertures. As shown in the second plot below, constricting the aperture provided a marked improvement in SNR (about 3 times the peak-peak variation).
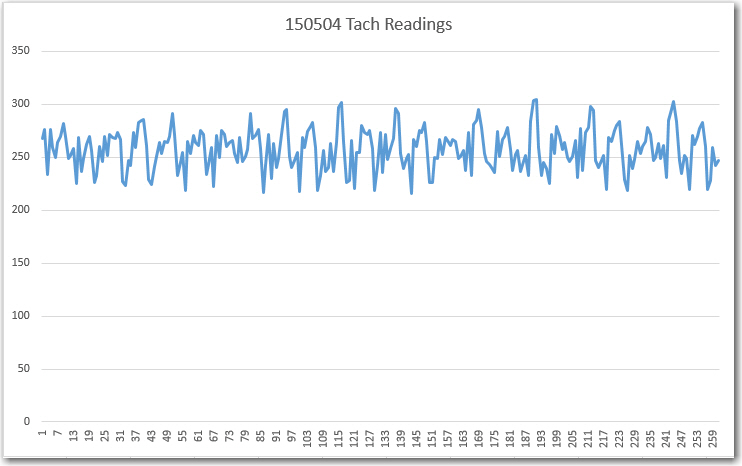
First test of the tach sensor system. Note the not-impressive variation between wheel slot and plug readings
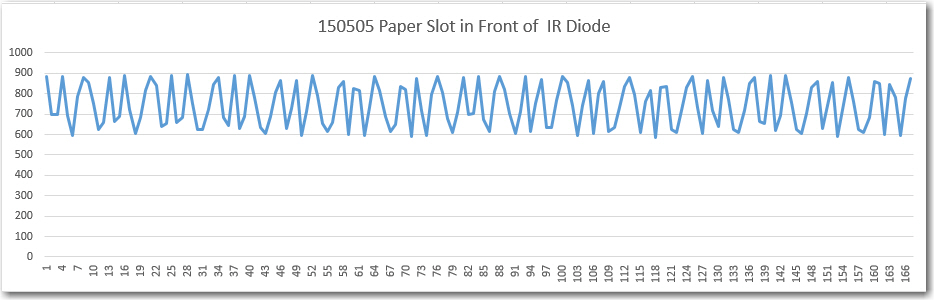
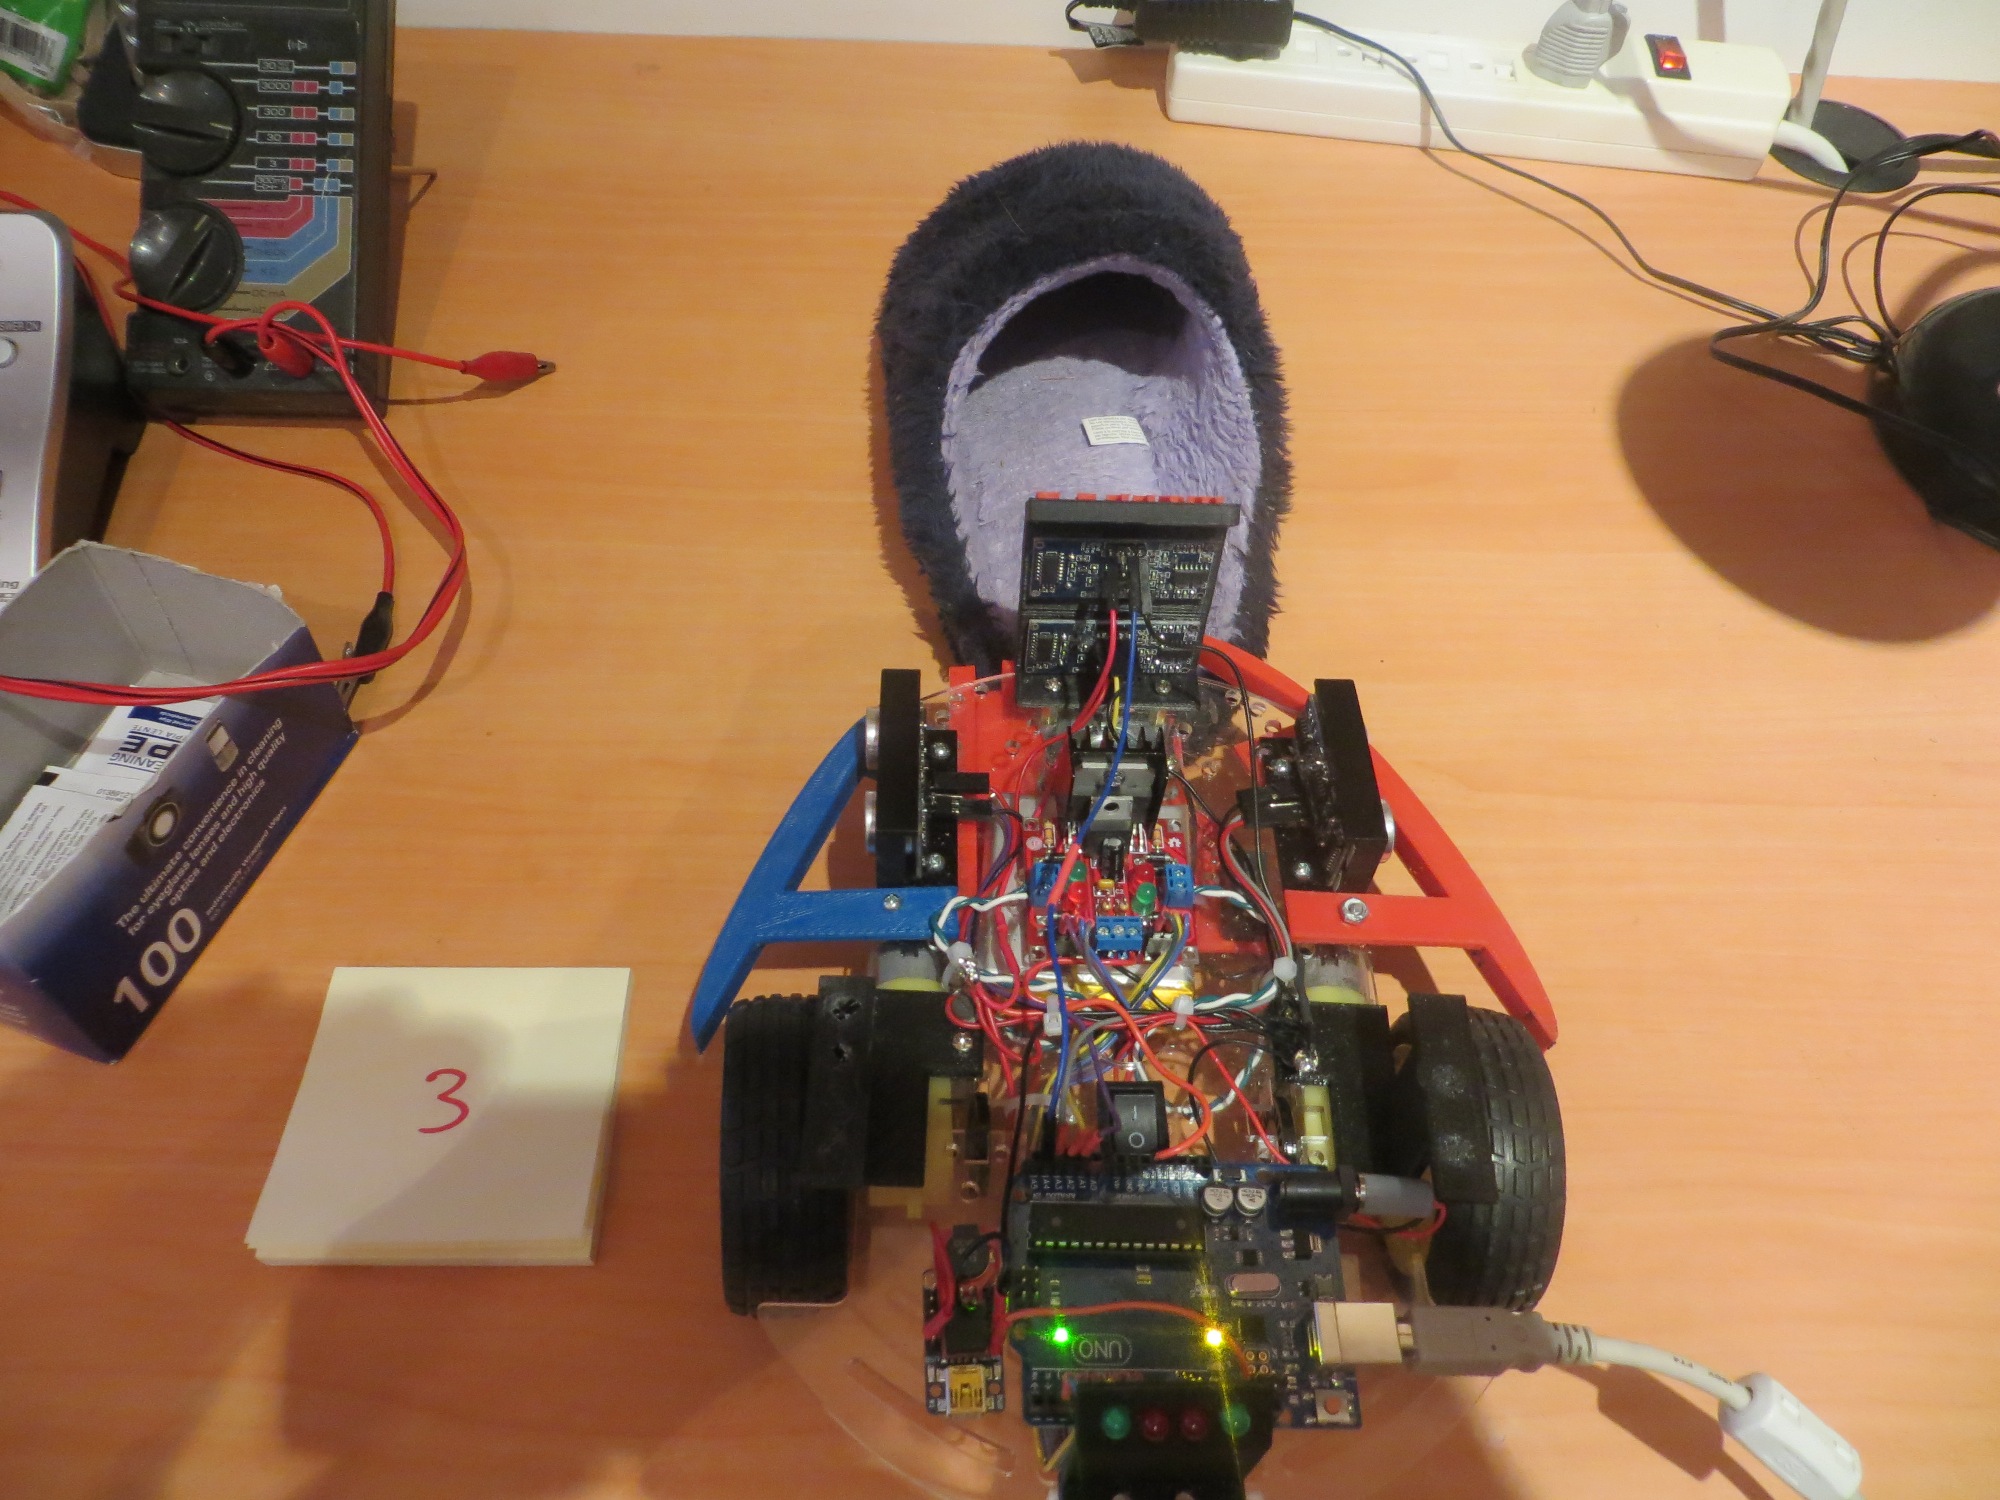
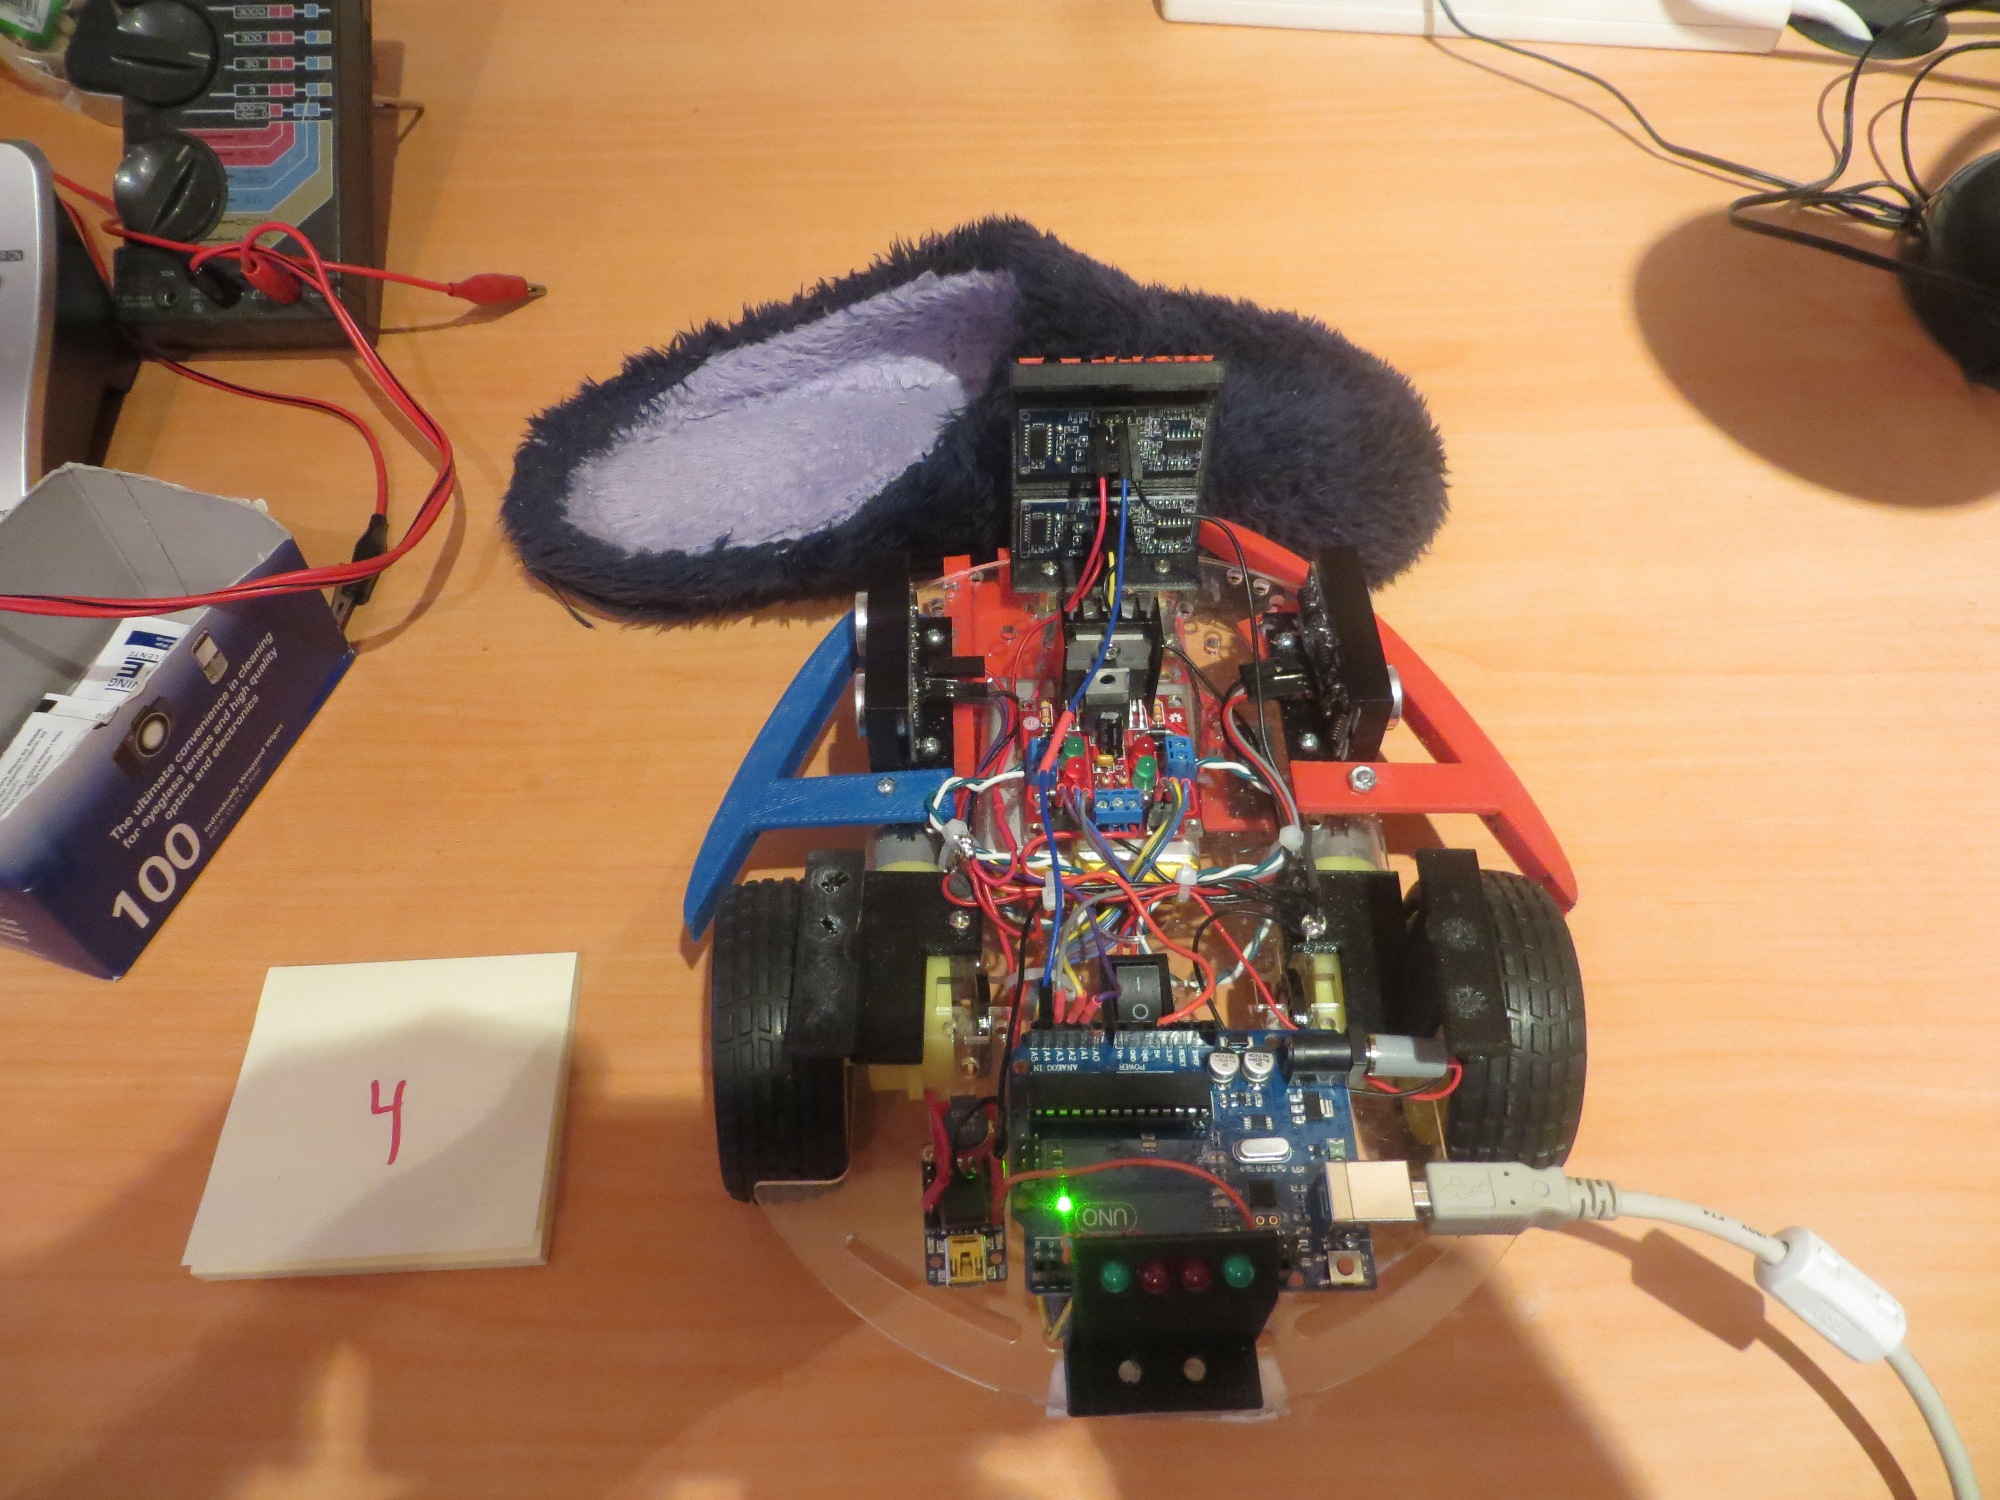
Paper barrier with a small slot placed in front of detector aperture
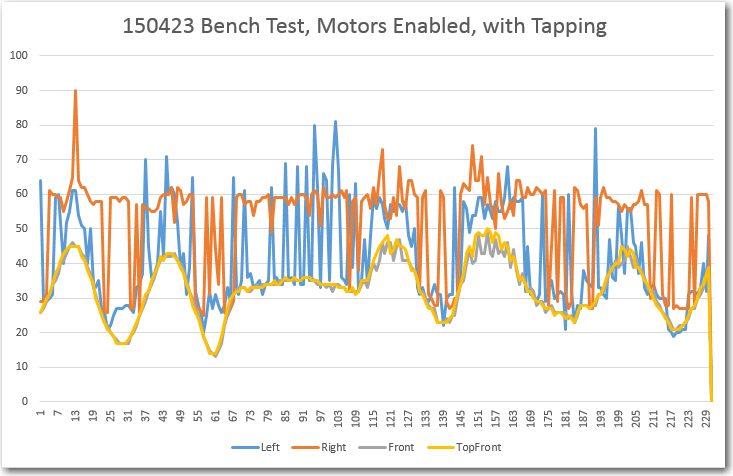
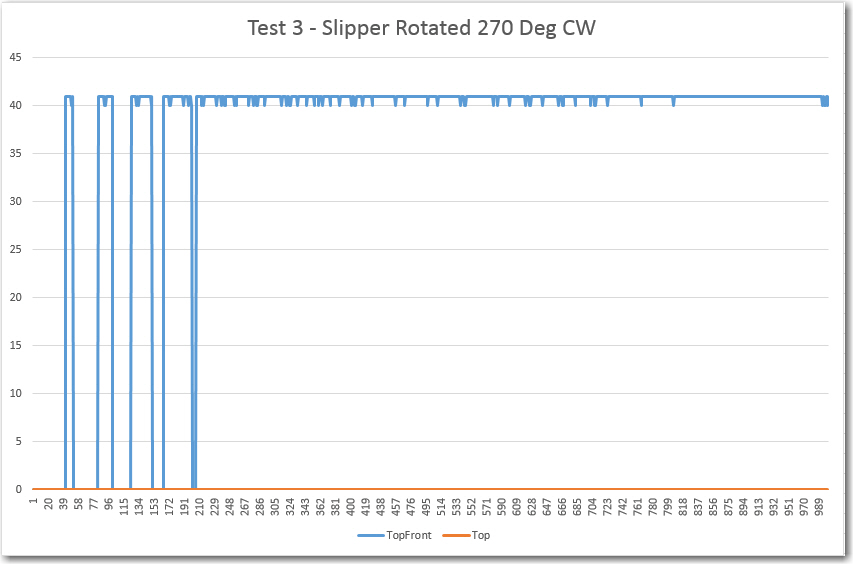
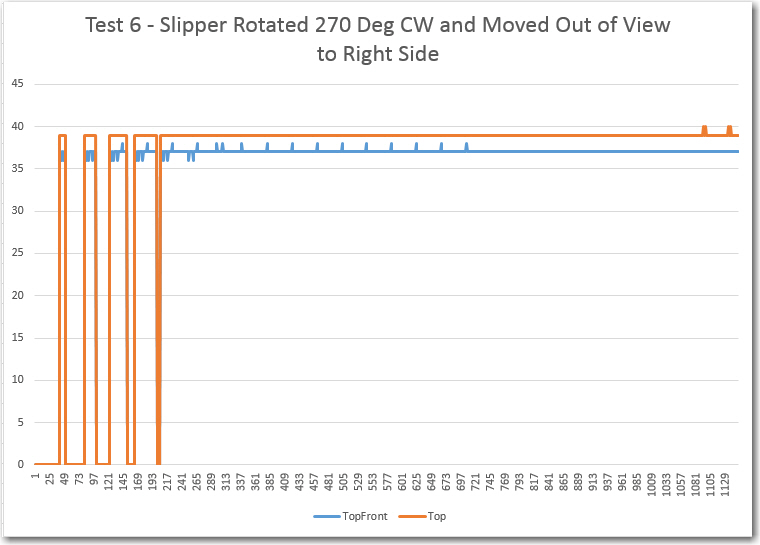
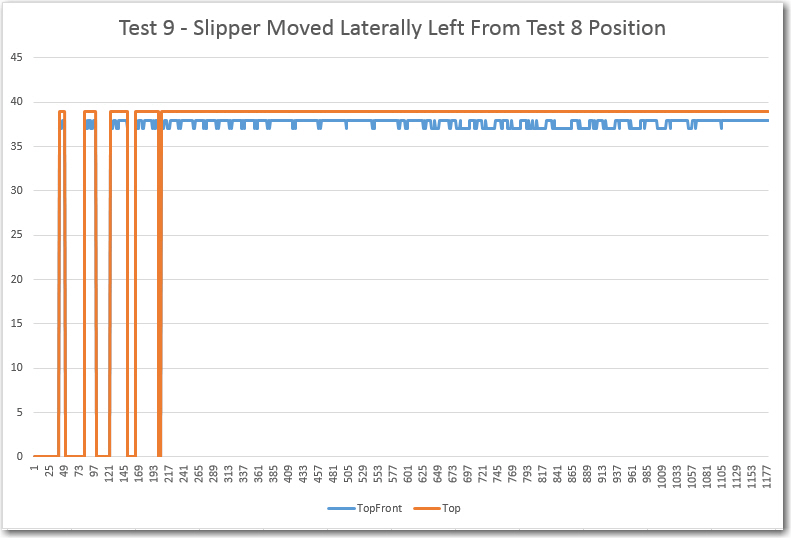
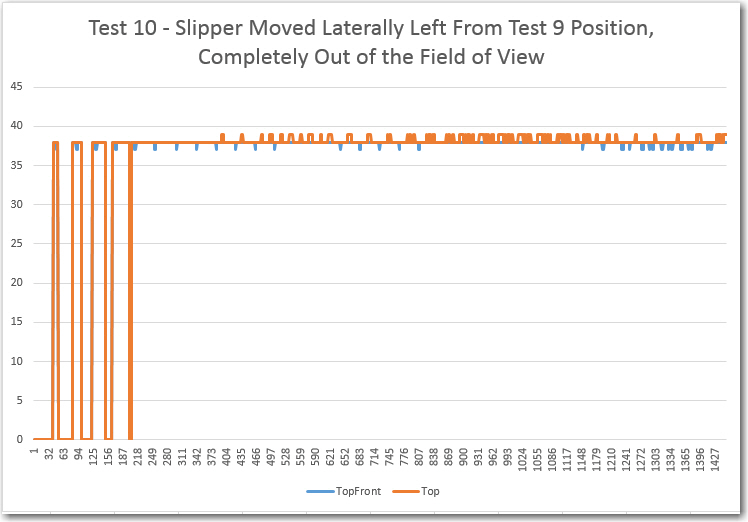
The above results led directly to the final round of evolutionary changes to the tach sensor bracket, where the detector aperture was changed from a large circle (same diameter as the IR LED) to a small slit. In addition, to further improve the SNR, the tach wheel itself was redesigned from 20 slots to 10 with the slots and plugs equal area. In addition one slot was removed to create an absolute wheel position ‘index mark’. After these changes, the tach sensor test was redone resulting in the following plot.
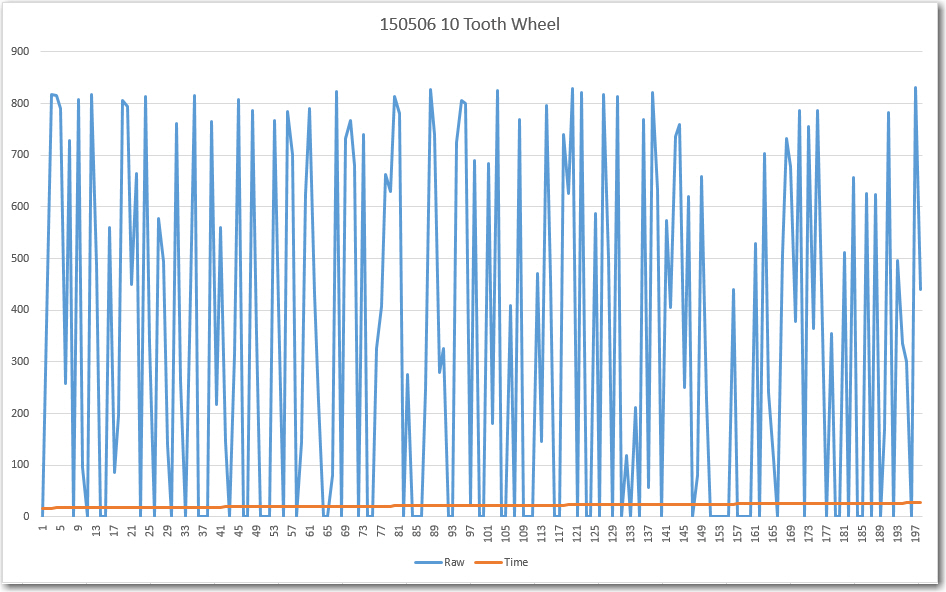
IR Detector response with a narrow slit aperture and a 10-tooth wheel.
Now the signal varies from 0 to 800, allowing easy and reliable ‘off’ to ‘on’ state detection, and index mark detection.
After incorporating the physical changes noted above, an Arduino program was developed to test whether or not the motor could be accurately speed controlled. Rather than trying to manually threshold-detect the above waveform, I simply used Mike Schwager’s very cool EnableInterrupt Library (see https://github.com/GreyGnome/EnableInterrupt) and set the Tach signal analog input to trigger an interrupt on each signal change. This resulted in two interrupts per slot position, but this was easily handled in the software.
After getting the program working, I found that I could control the motor such that, when set to 60 rpm, 20 wheel revolutions (as measured by counting the scotch tape on the wheel) took exactly 20 seconds.
Well, I’m not quite sure where I’m going from here. Now I have demonstrated that I can control a typical hobbyist/robot motor for use as a LIDAR turret. However, I’m not entirely convinced that a spinning LIDAR can produce wall distance measurements fast enough for successful wall following, and it will be a major PITA to modify Wall-E sufficiently to find out. For one thing, I can’t really use one of Wall-E’s drive wheels as the LIDAR turret motor without giving Wall-E an unacceptable ‘limp’ (If I did that, I guess I would have to change his name from ‘Wall-E’ to ‘Quasimodo’ ;-)). For another, to mount the LIDAR and turret on the current Wall-E chassis would be a major project by itself, as Wall-E’s real estate is already heavily populated with ‘stuff’.
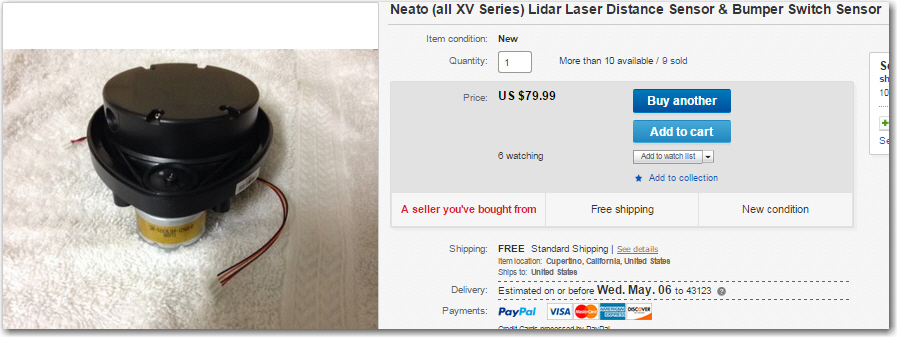
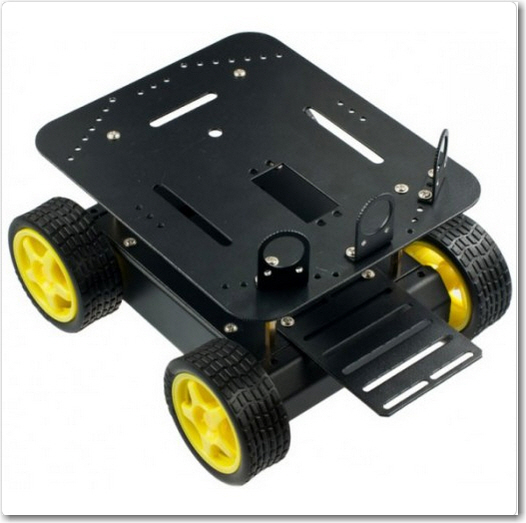
So, I think I’m going to wait until my new 4WD robot chassis arrives (it was unfortunately delayed for a week or so), and then build it up from scratch as a LIDAR-only platform. I can then use one of the motors from Wall-E as the turret motor for the PulsedLight LIDAR-Lite system. In the meantime, I think I’ll try and mount the NEATO XV-11 spinning LIDAR on Wall-E, as it doesn’t require any additional motors (it has its own motor built in), and see if I can successfully follow a wall using only LIDAR.
Stay Tuned…
Frank