Posted 02 November 2016
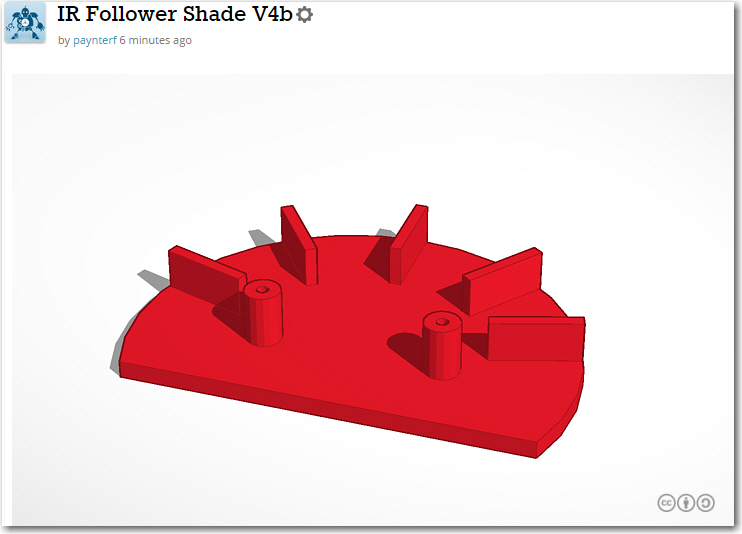
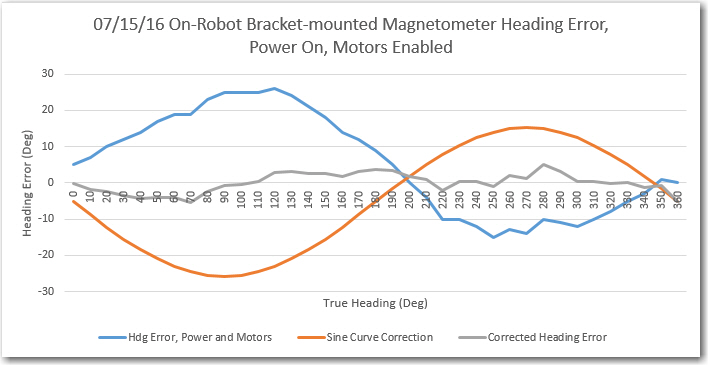
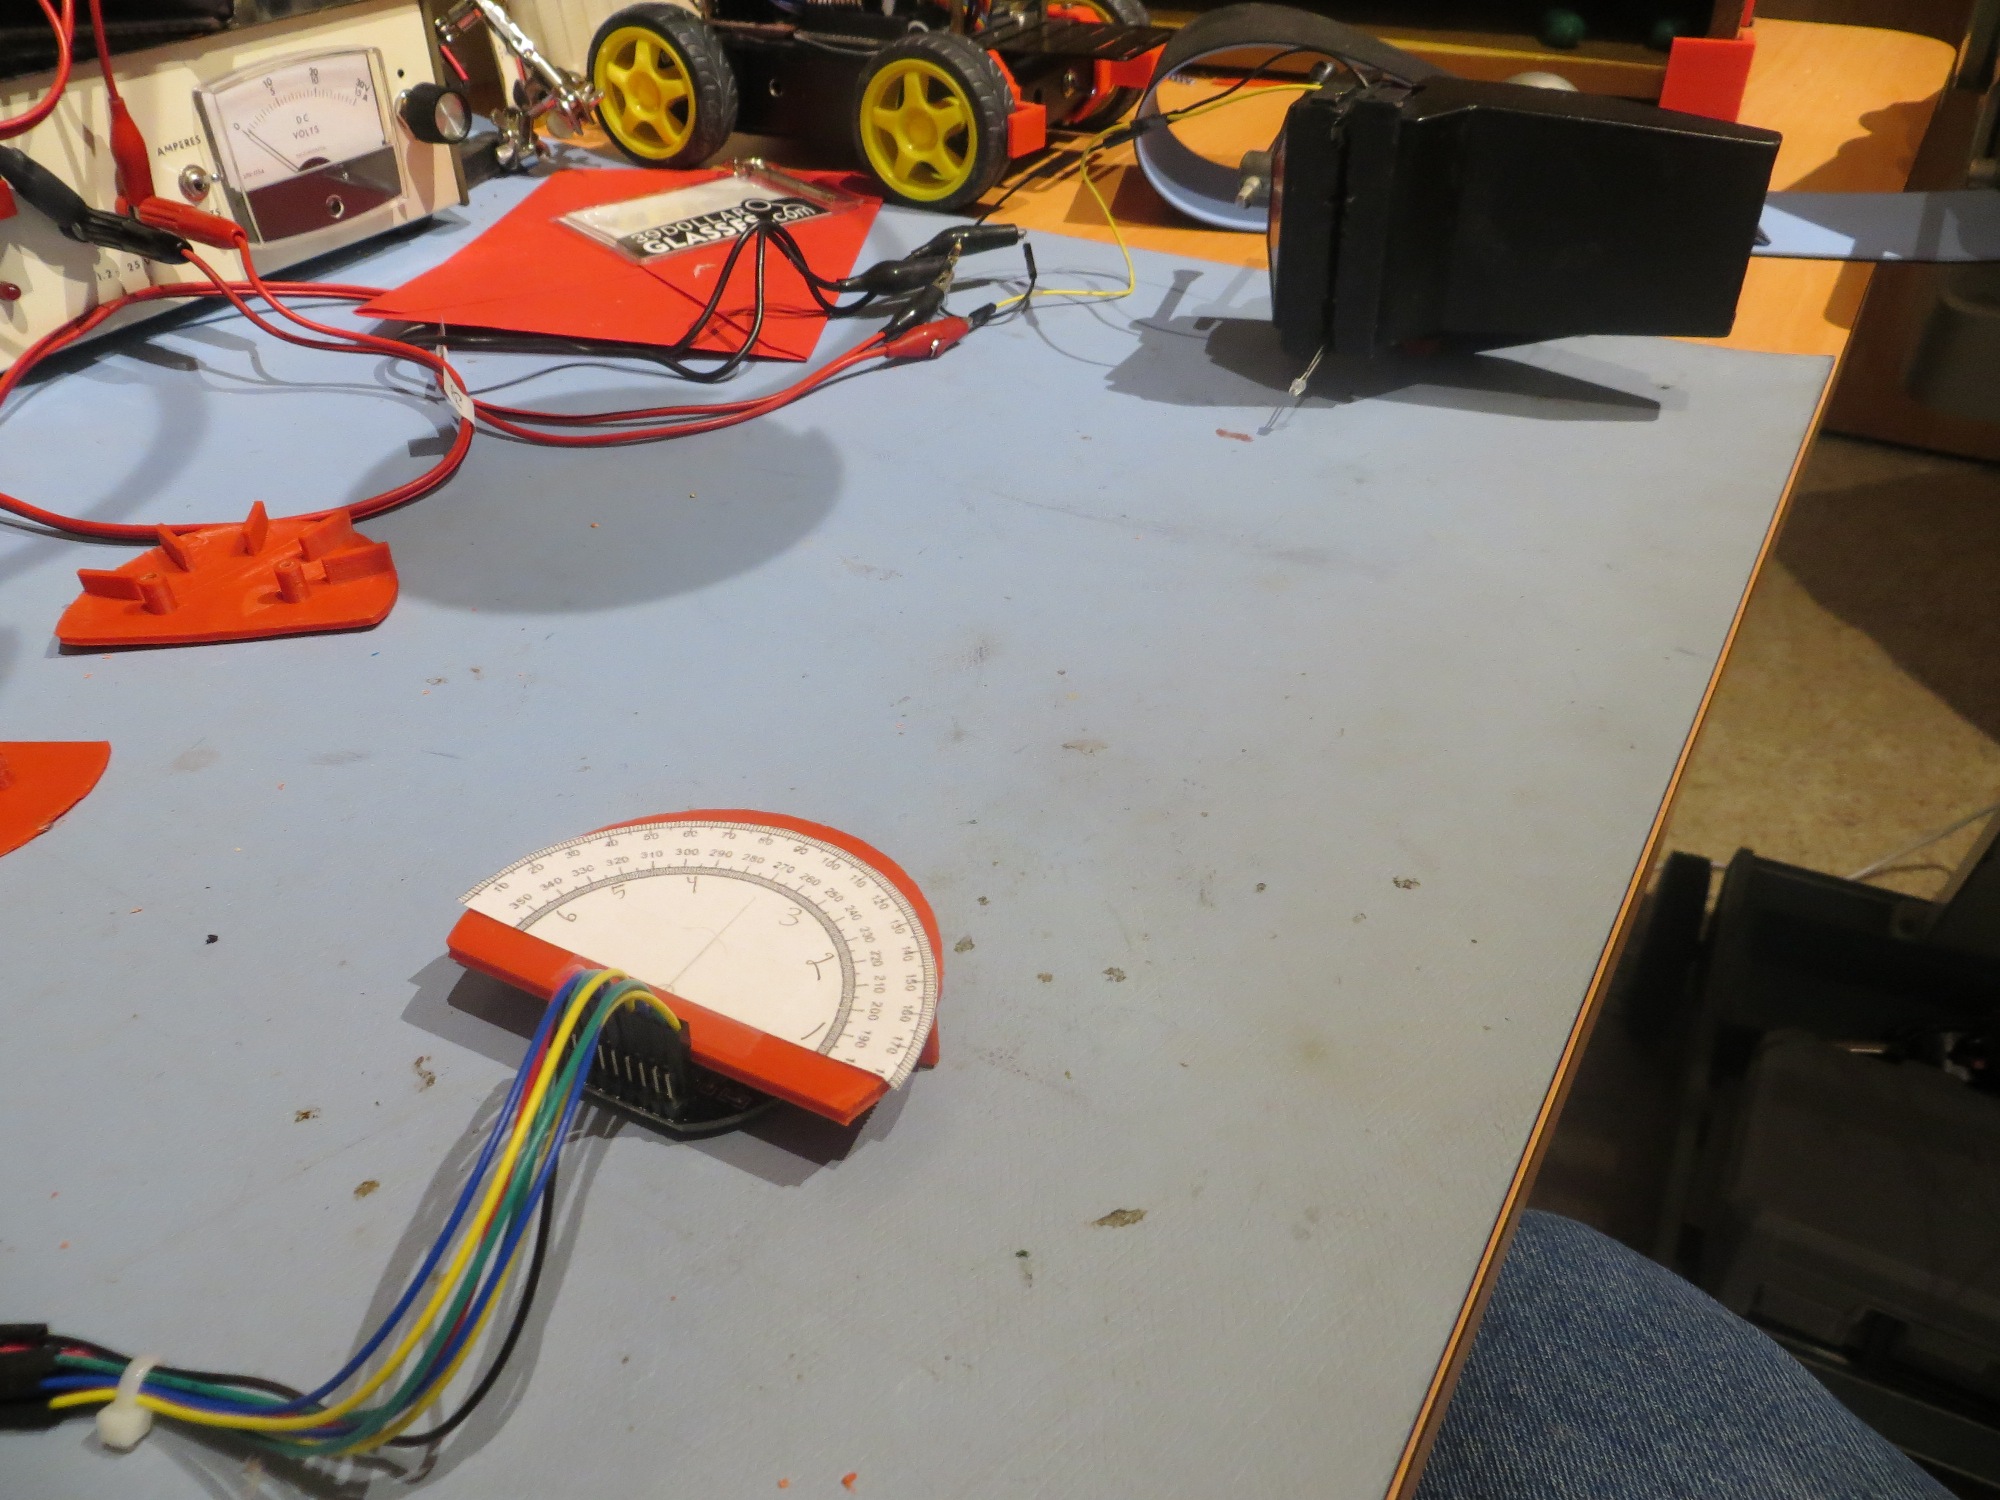
After arriving at a ‘sunshade’ design that completely blocked overhead IR source interference, I went back to my bench-top range to re-do the directionality testing. To do this I printed out a scaled copy of my 4-Inch Heading Circle graphic from a previous project, and modified it to serve as a heading indicator for the IR follower tests, as shown below
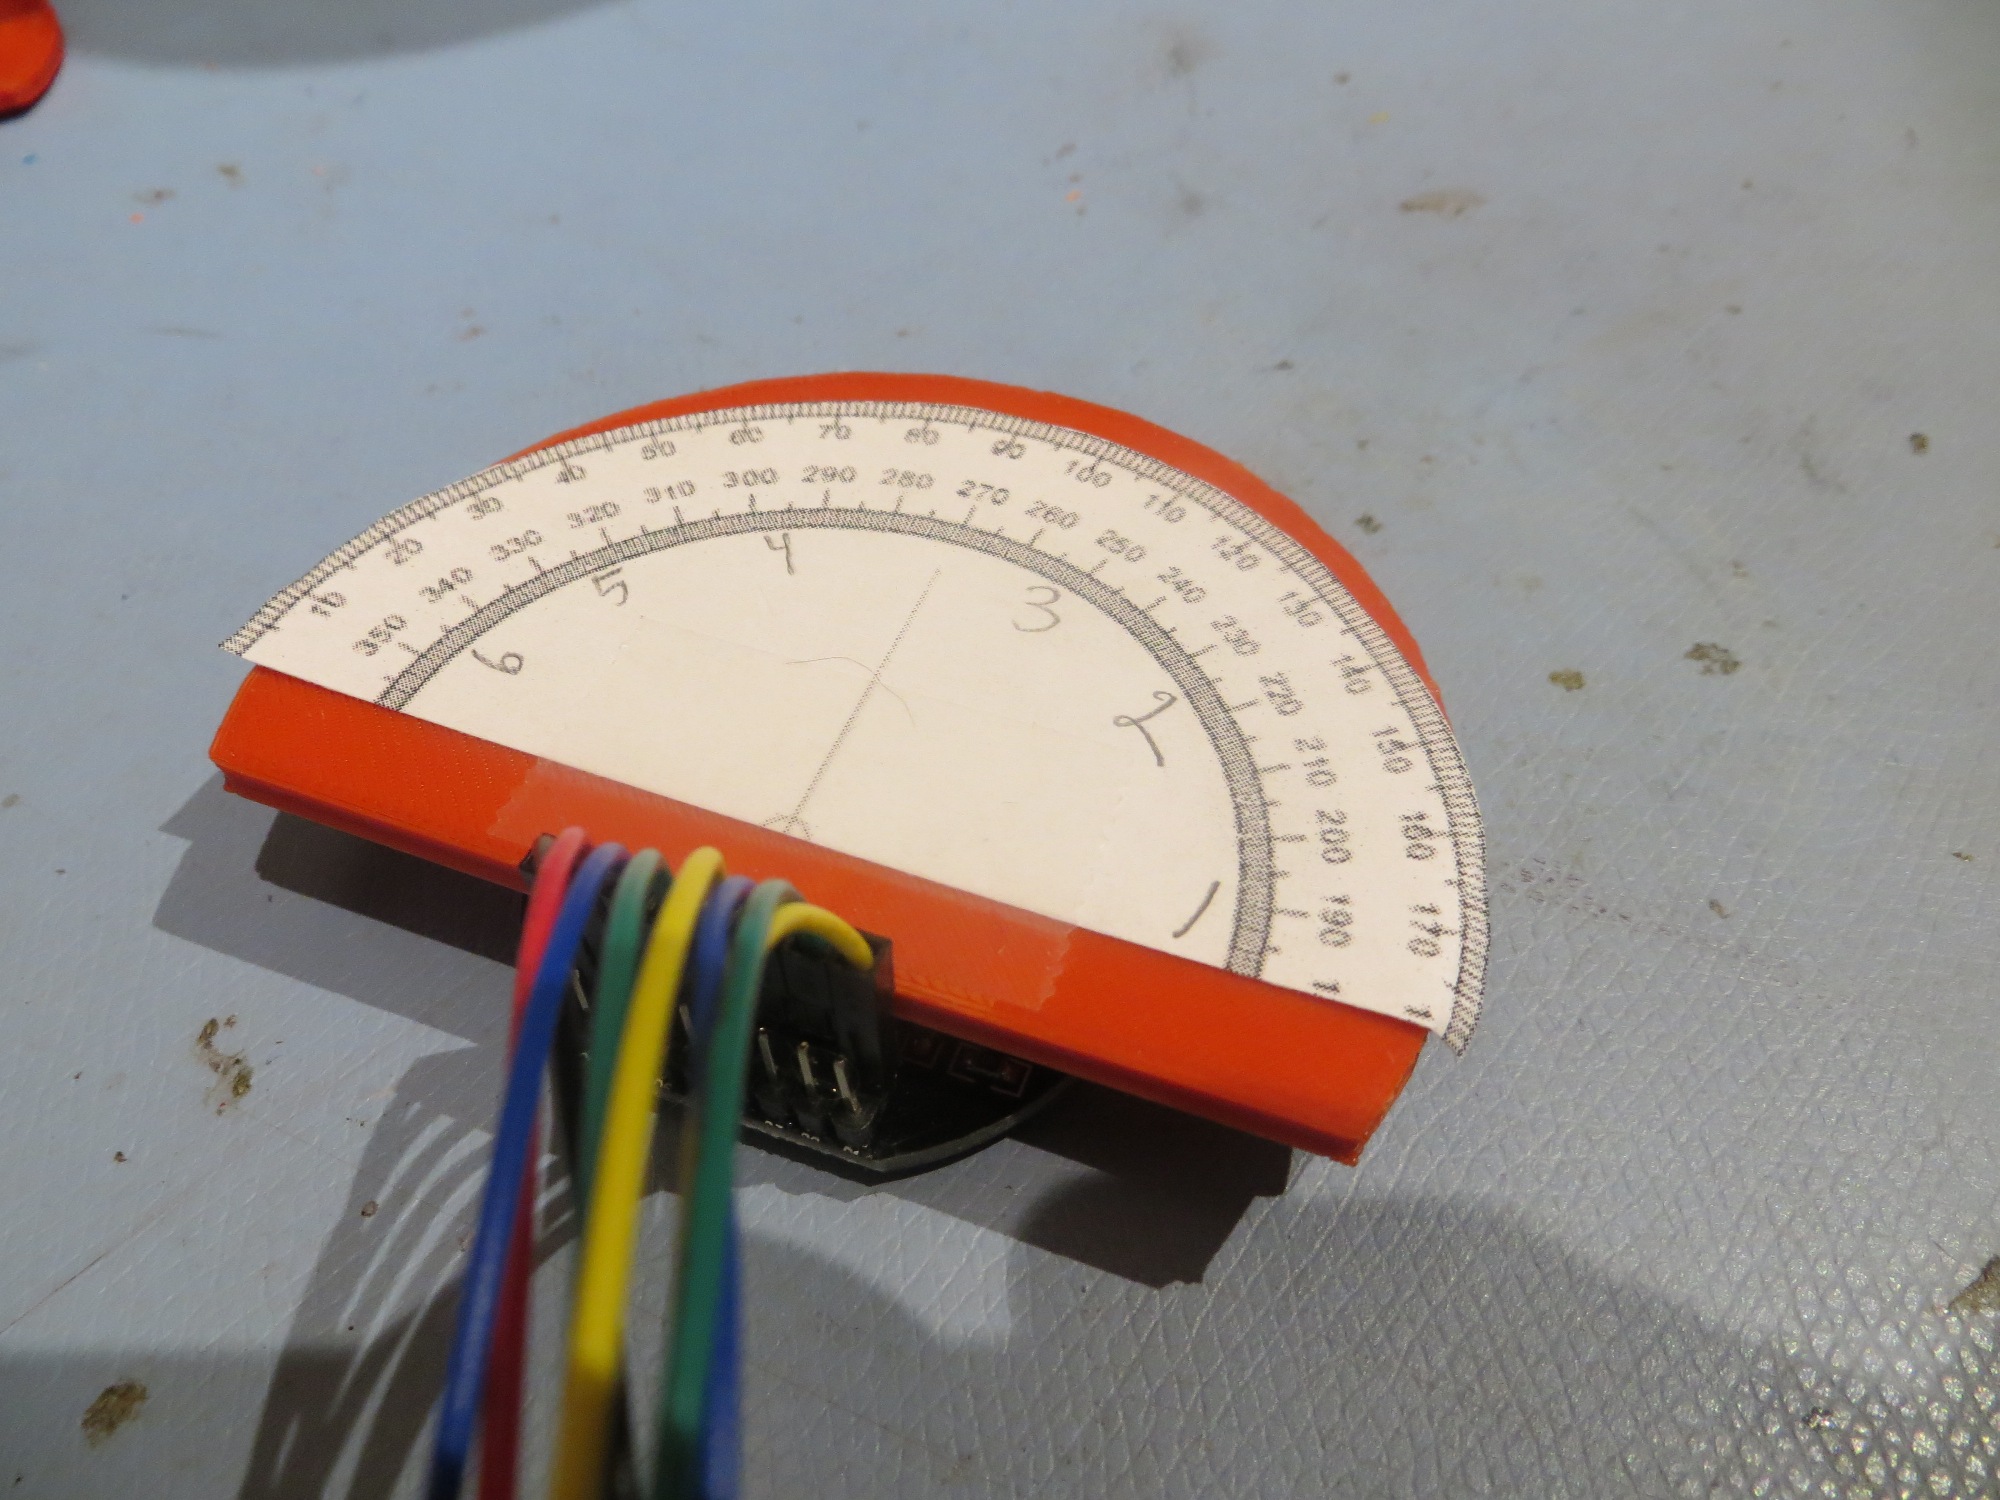
Heading circle image, modified for heading tests. Penciled numbers are detector designators
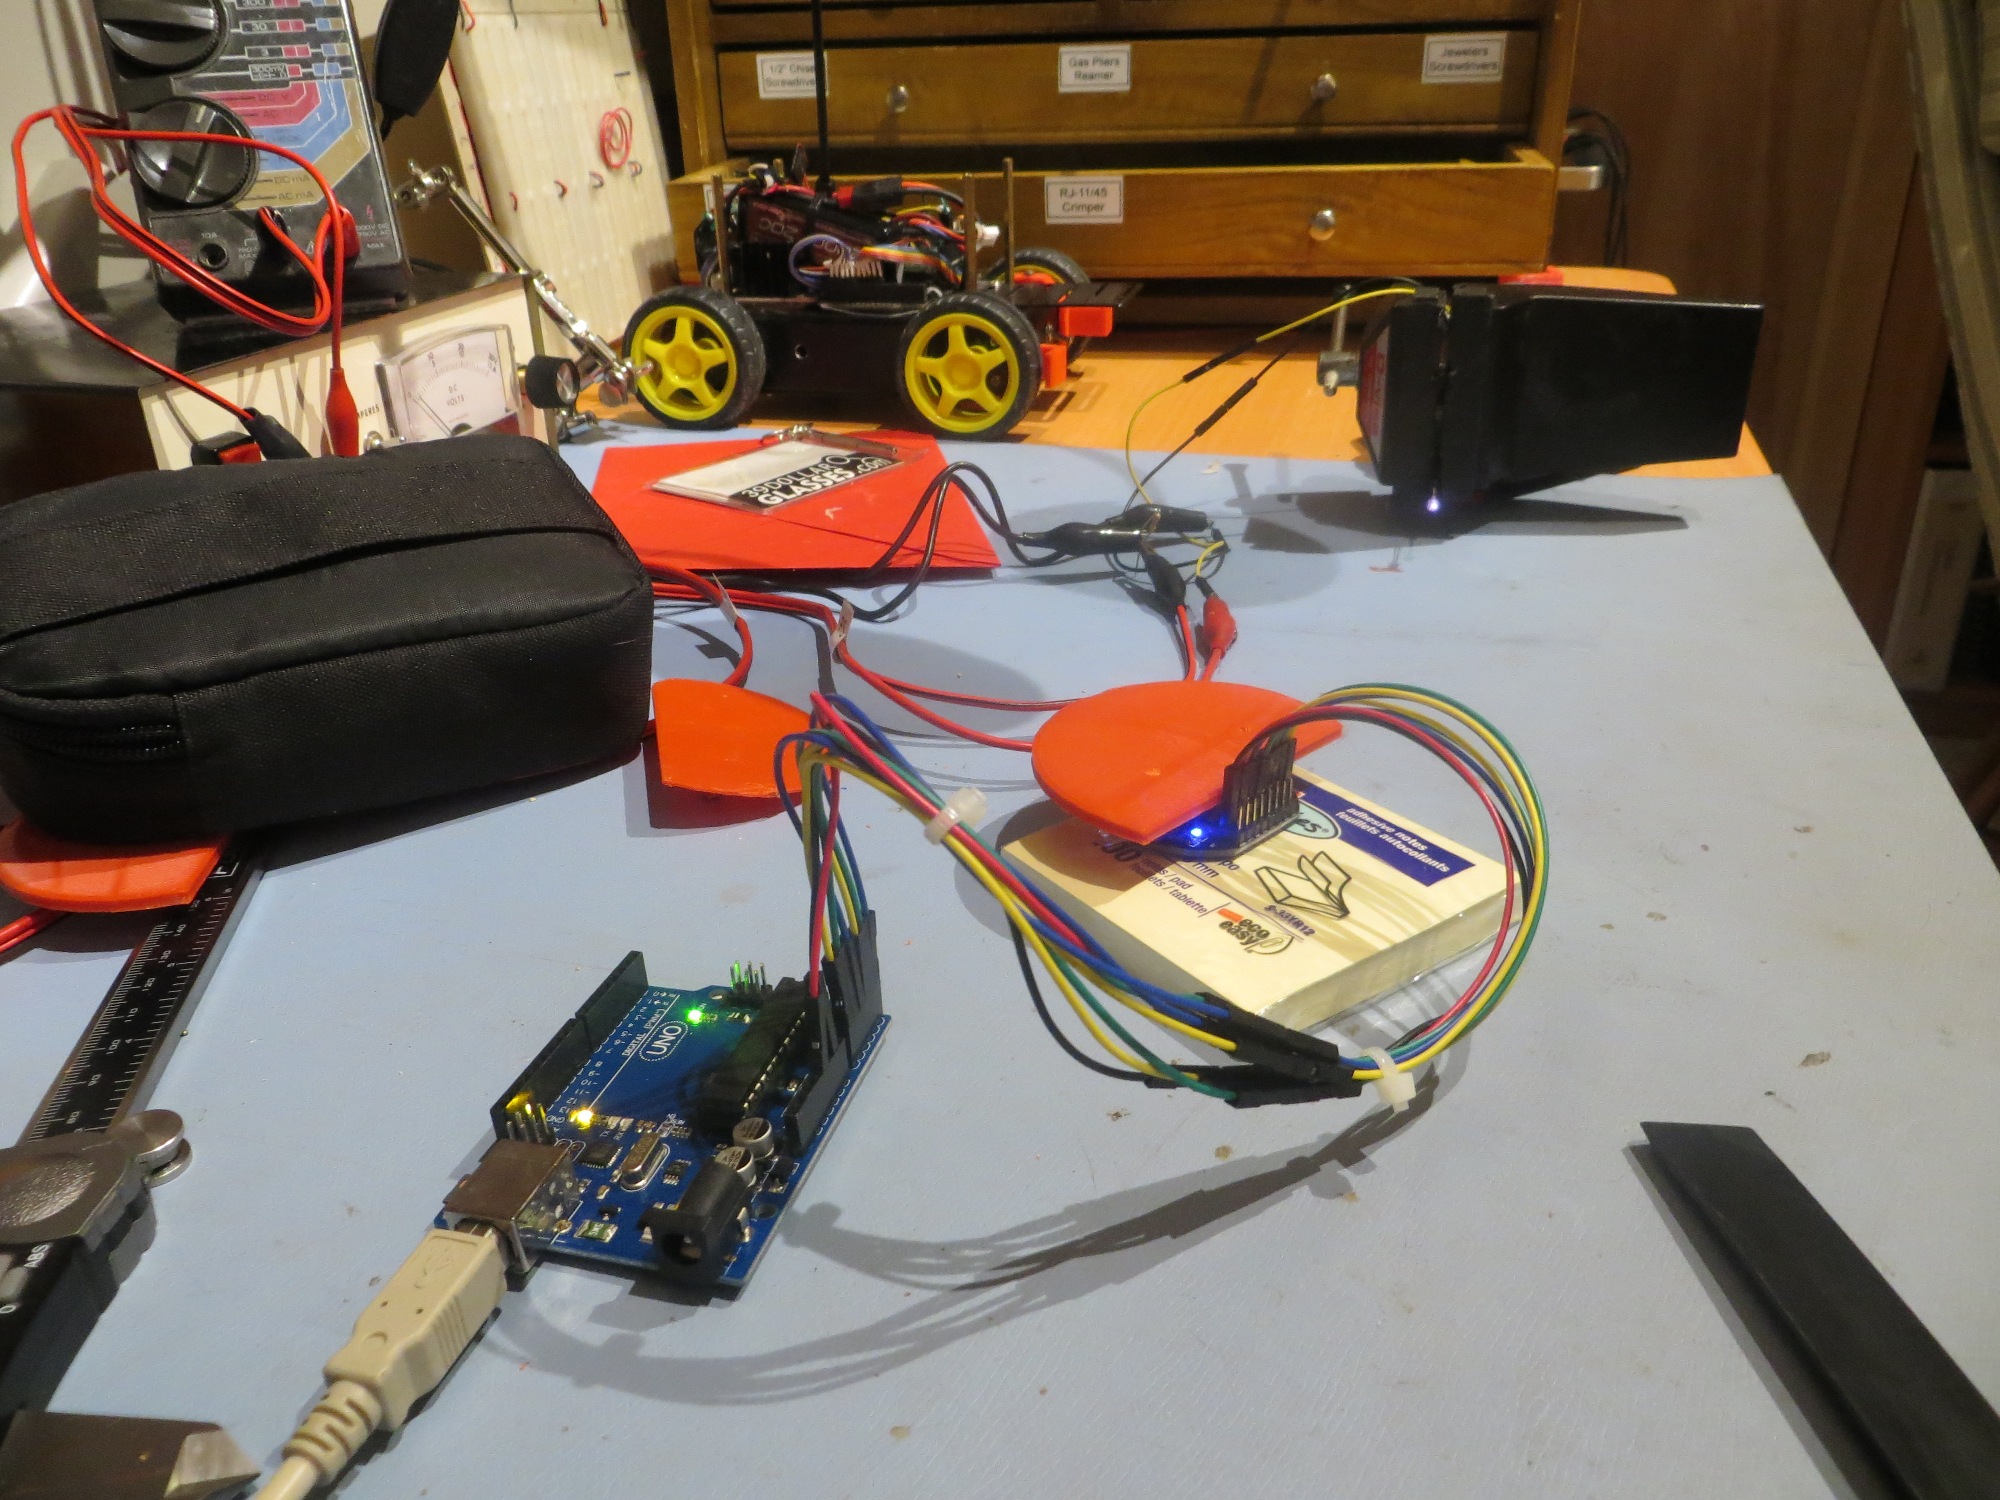
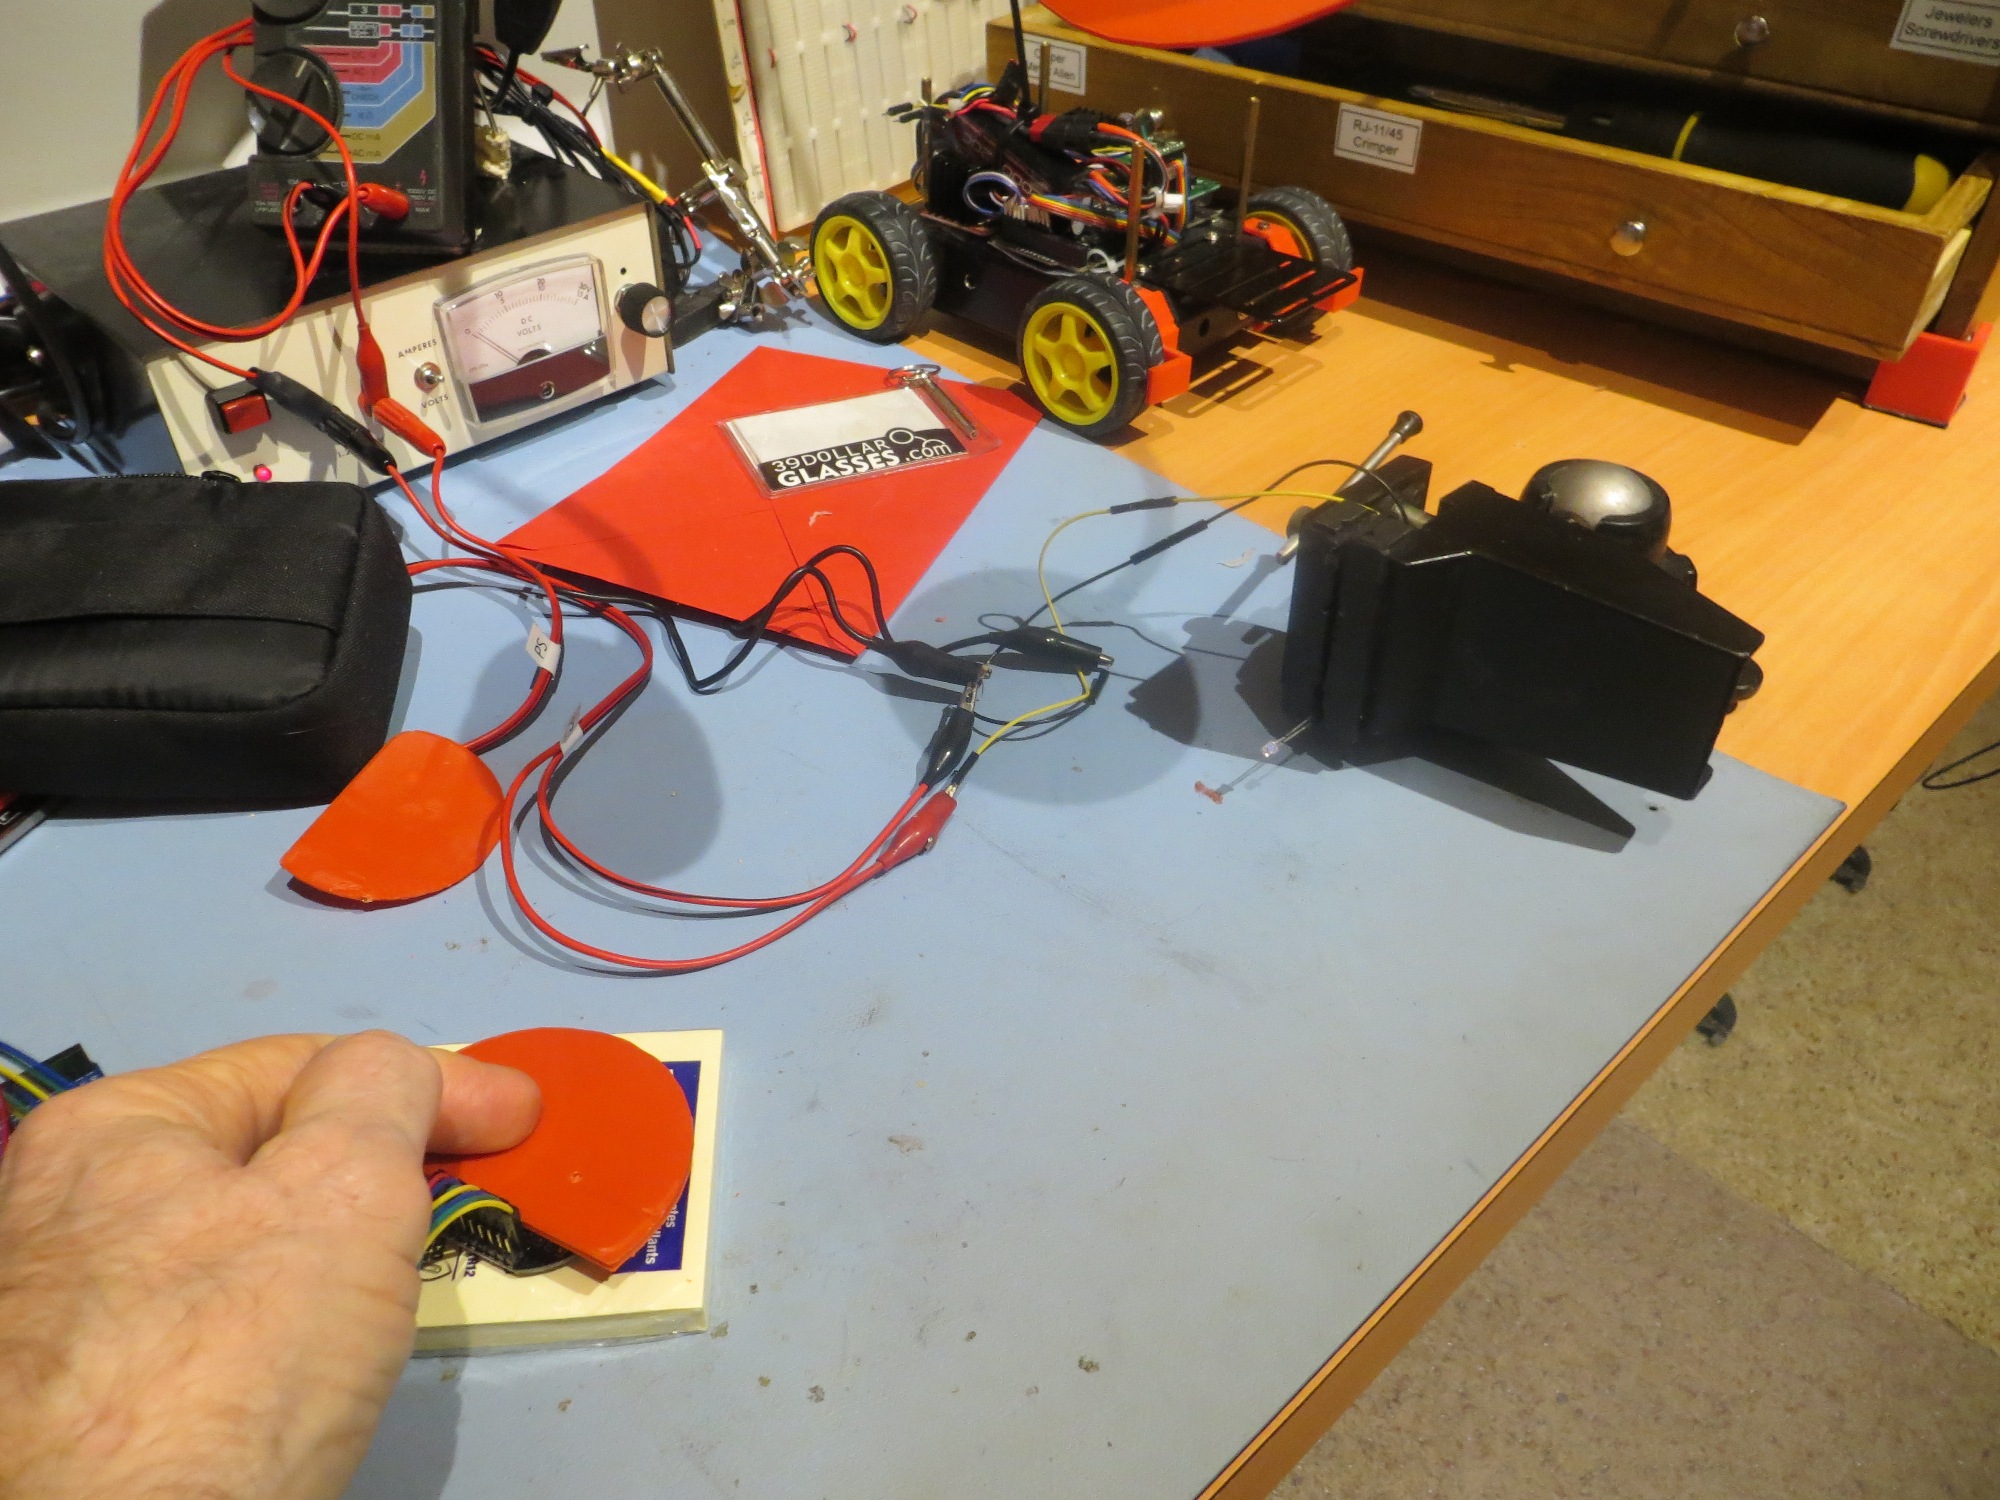
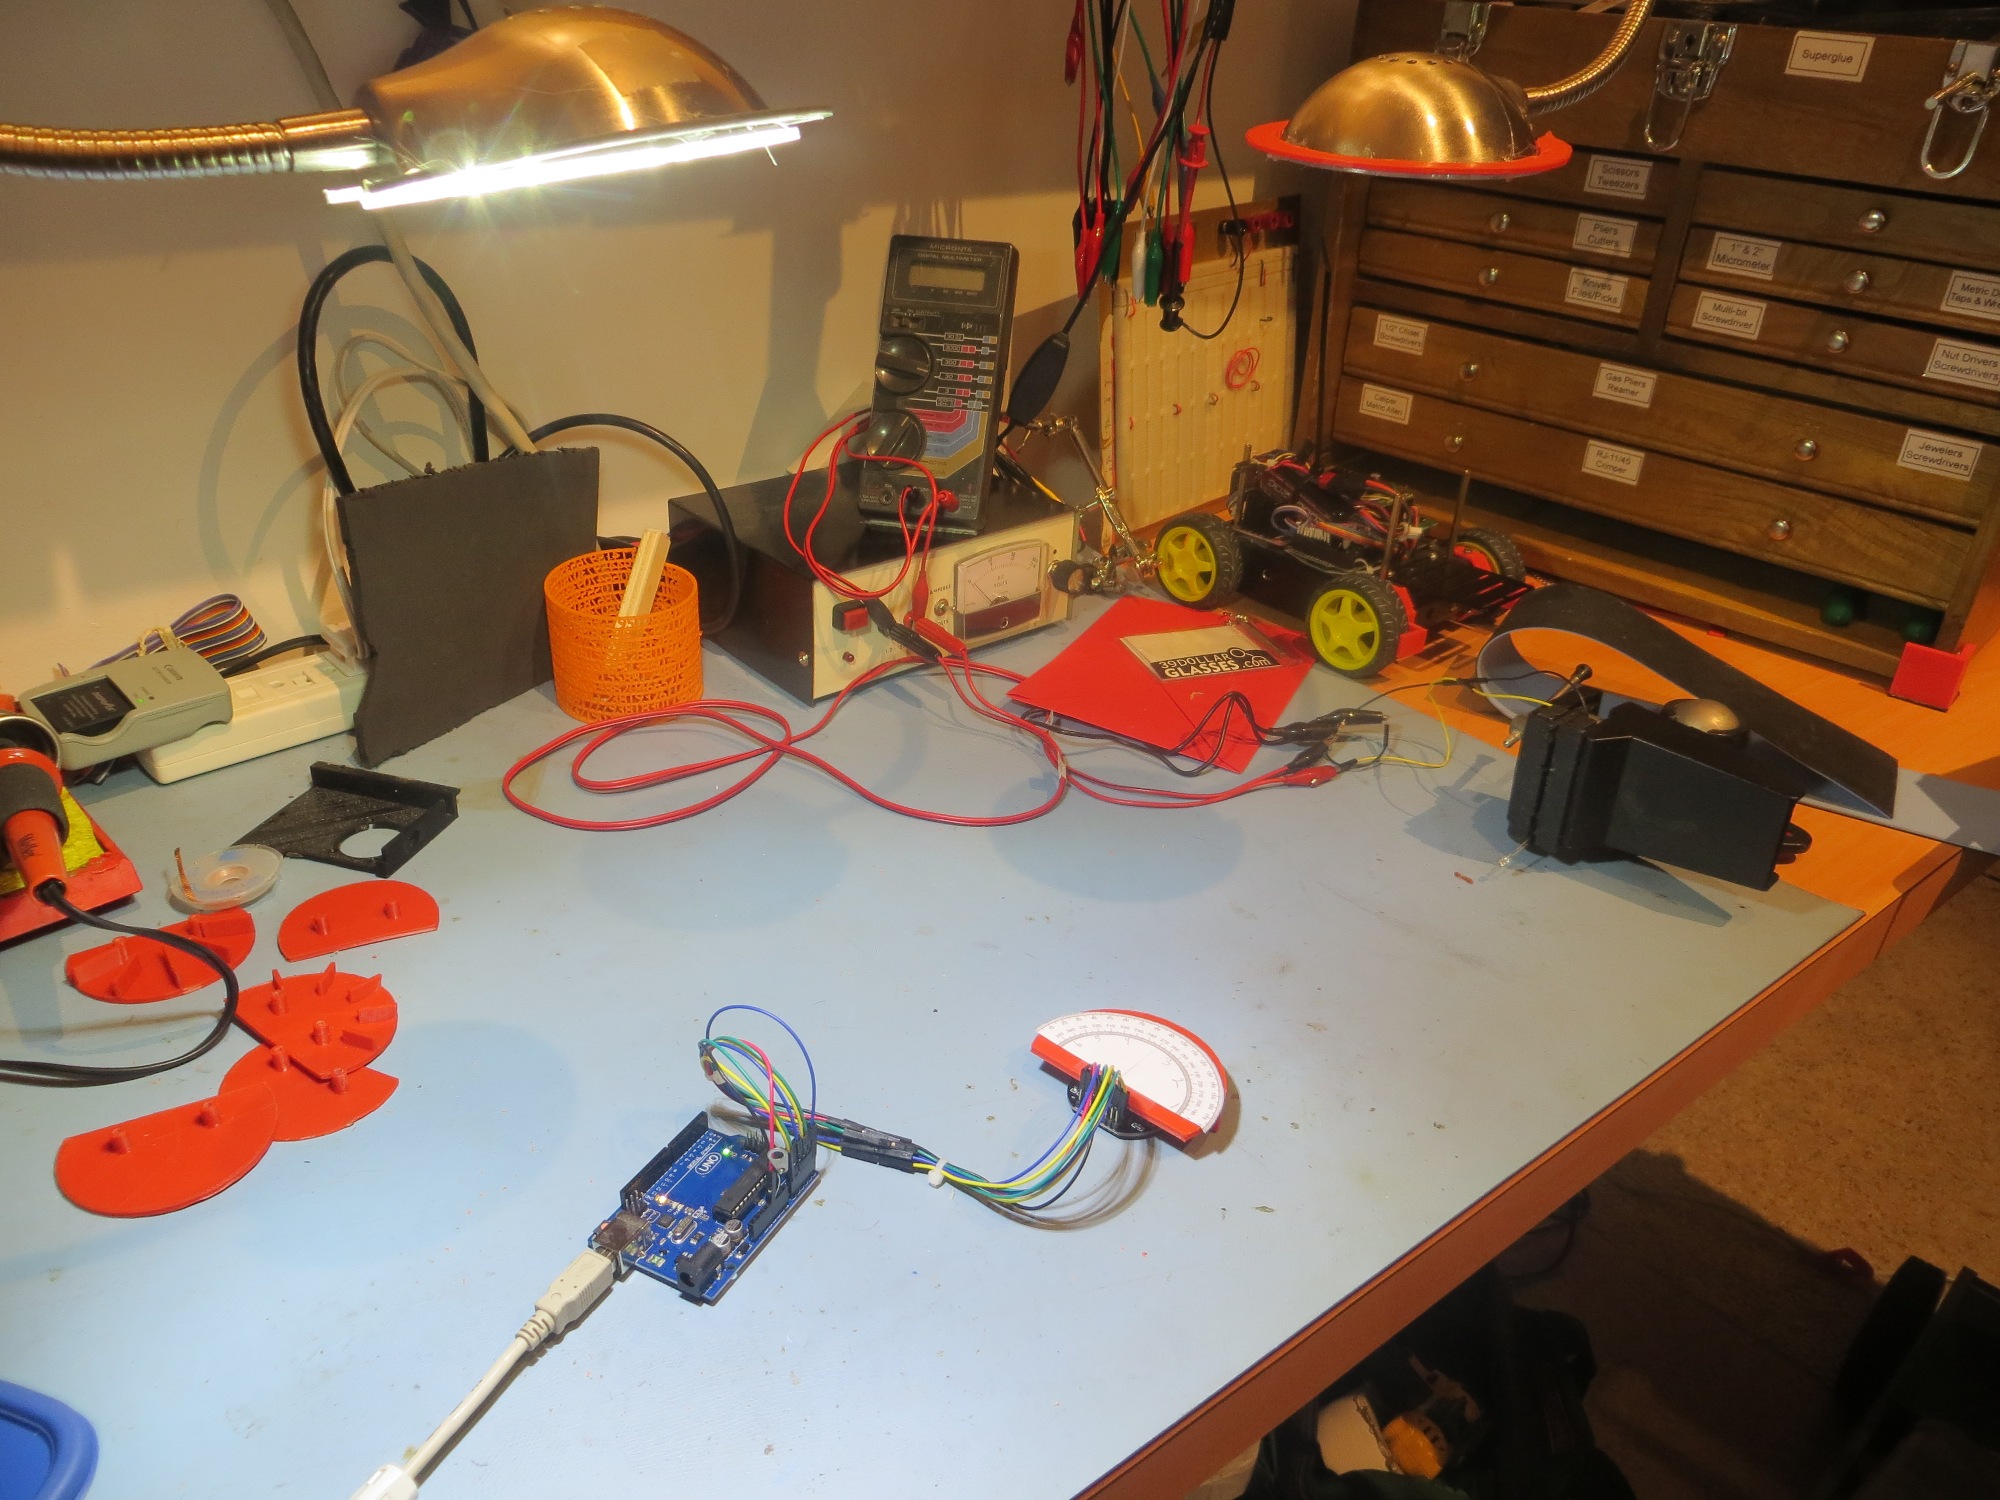
Heading test setup. IR emitter LED is clamped to the bench vise in the background.
To perform the tests, I created a small Arduino program to read and print out the analog readings from all six IR photodetectors, and recorded the results in a Excel spreadsheet. Then, using Excel’s superb graphing tools, I plotted the outputs, as shown below.
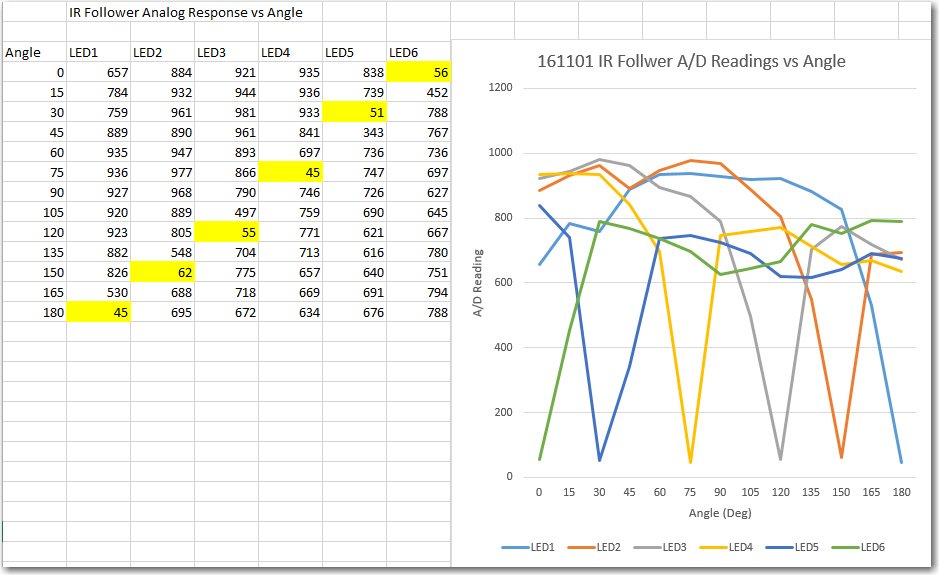
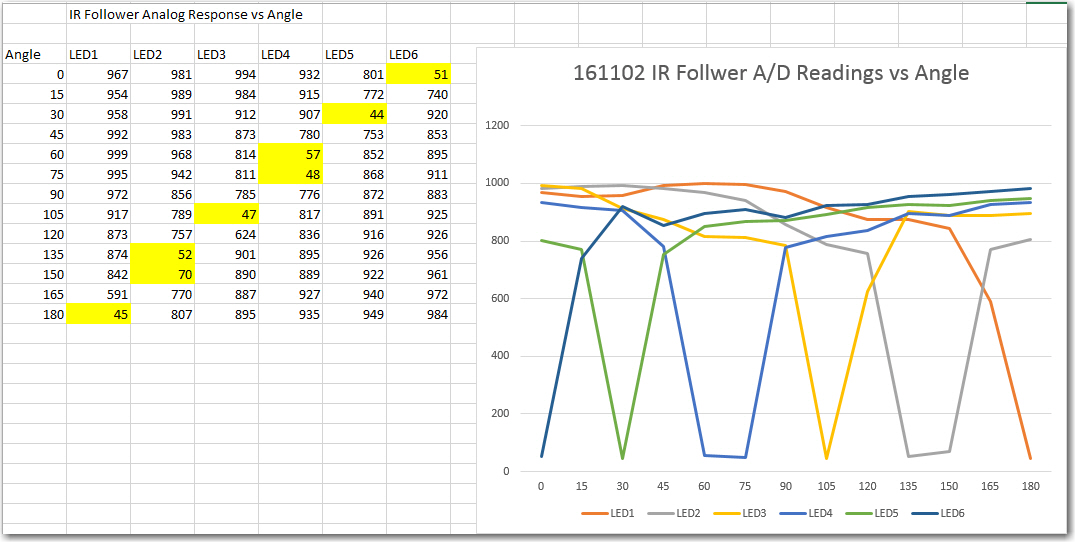
Results from first heading tests on bench-top range. Minimum values for each photodetector are highlighted
As can be seen in the above results, the photodetectors read around 700-900 when no IR is present, and 50-60 when the detector aligned with the IR beam. As can be seen, the heading response for each individual detector was rather narrow, with the minimum occurring at only one heading, with essentially zero detection on either side of the minimum value. These results are a bit problematic, as the wide ‘dead zones’ between detection angles may make it difficult to derive good motor steering commands for IR homing.
To determine if the above ‘dead zone’ issue is due to the inherent directivity of the detectors or to the optical isolation provided by the sunshade vanes, I decided to manually pare back the isolation vanes in small steps to determine their influence on the dead zones, and to determine if I could do so without adversely impacting overhead IR source suppression. As a control, I took A/D readings with the LED emitter disabled, but with one overhead LED bench light turned on (this is known to be a strong IR emitter), as shown below:
A/D reading test with LED emitter OFF and one LED bench light ON. Note black foam piece blocking reflection from power strip in background
With this setup, I got the following readings with the IR LED disabled and the bench light ON:
LED1 LED2 LED3 LED4 LED5 LED6
712 796 847 864 731 818
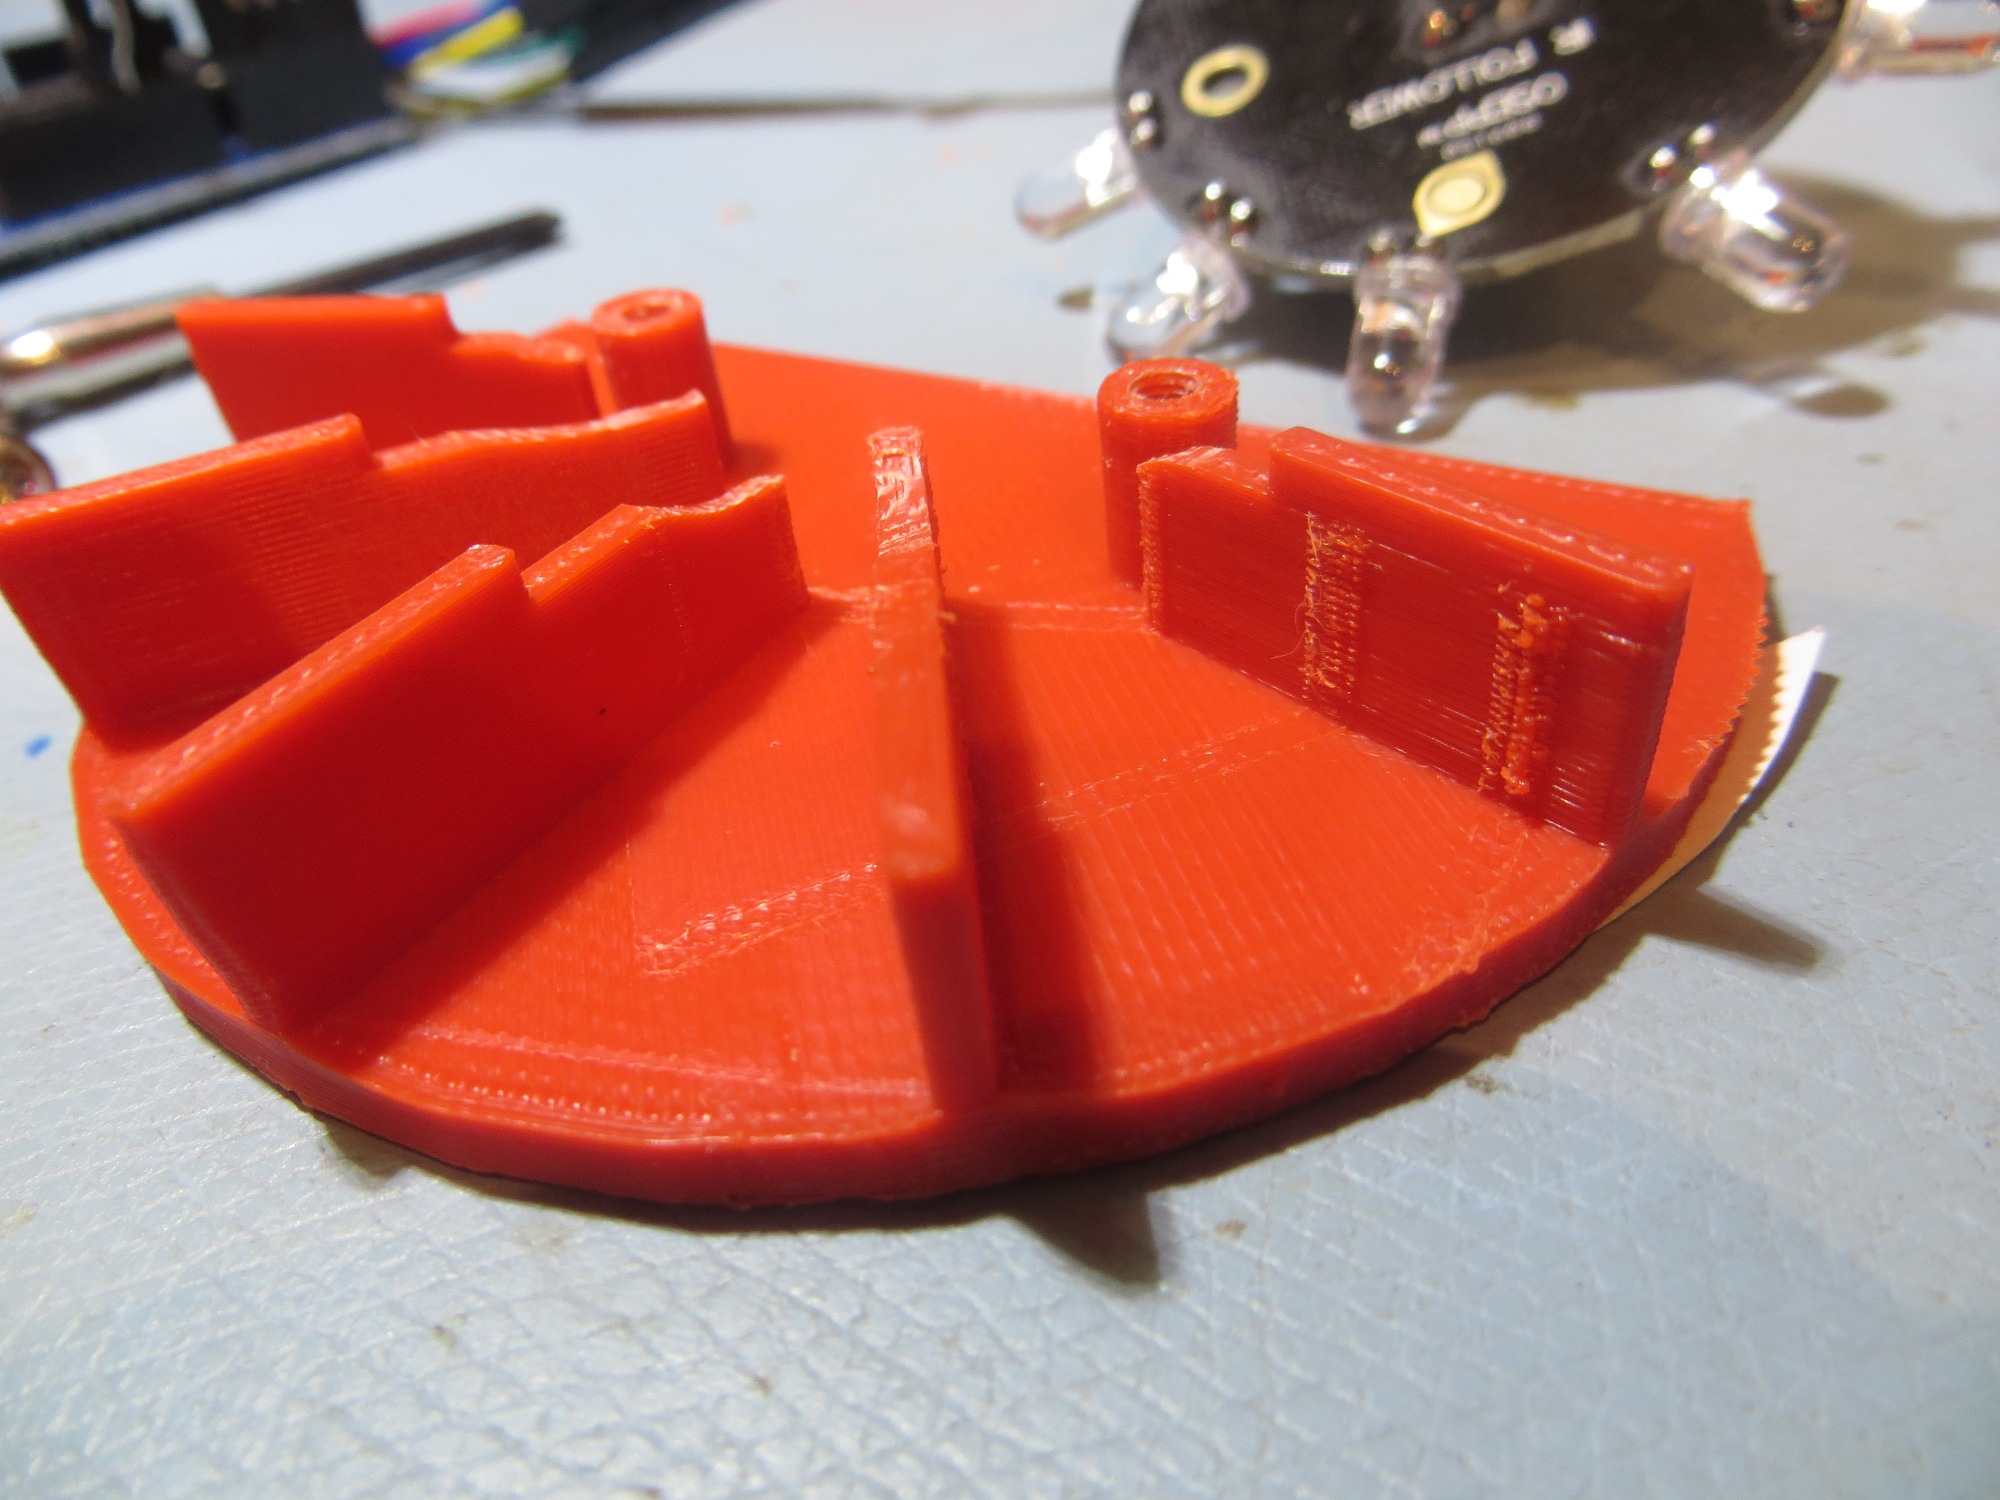
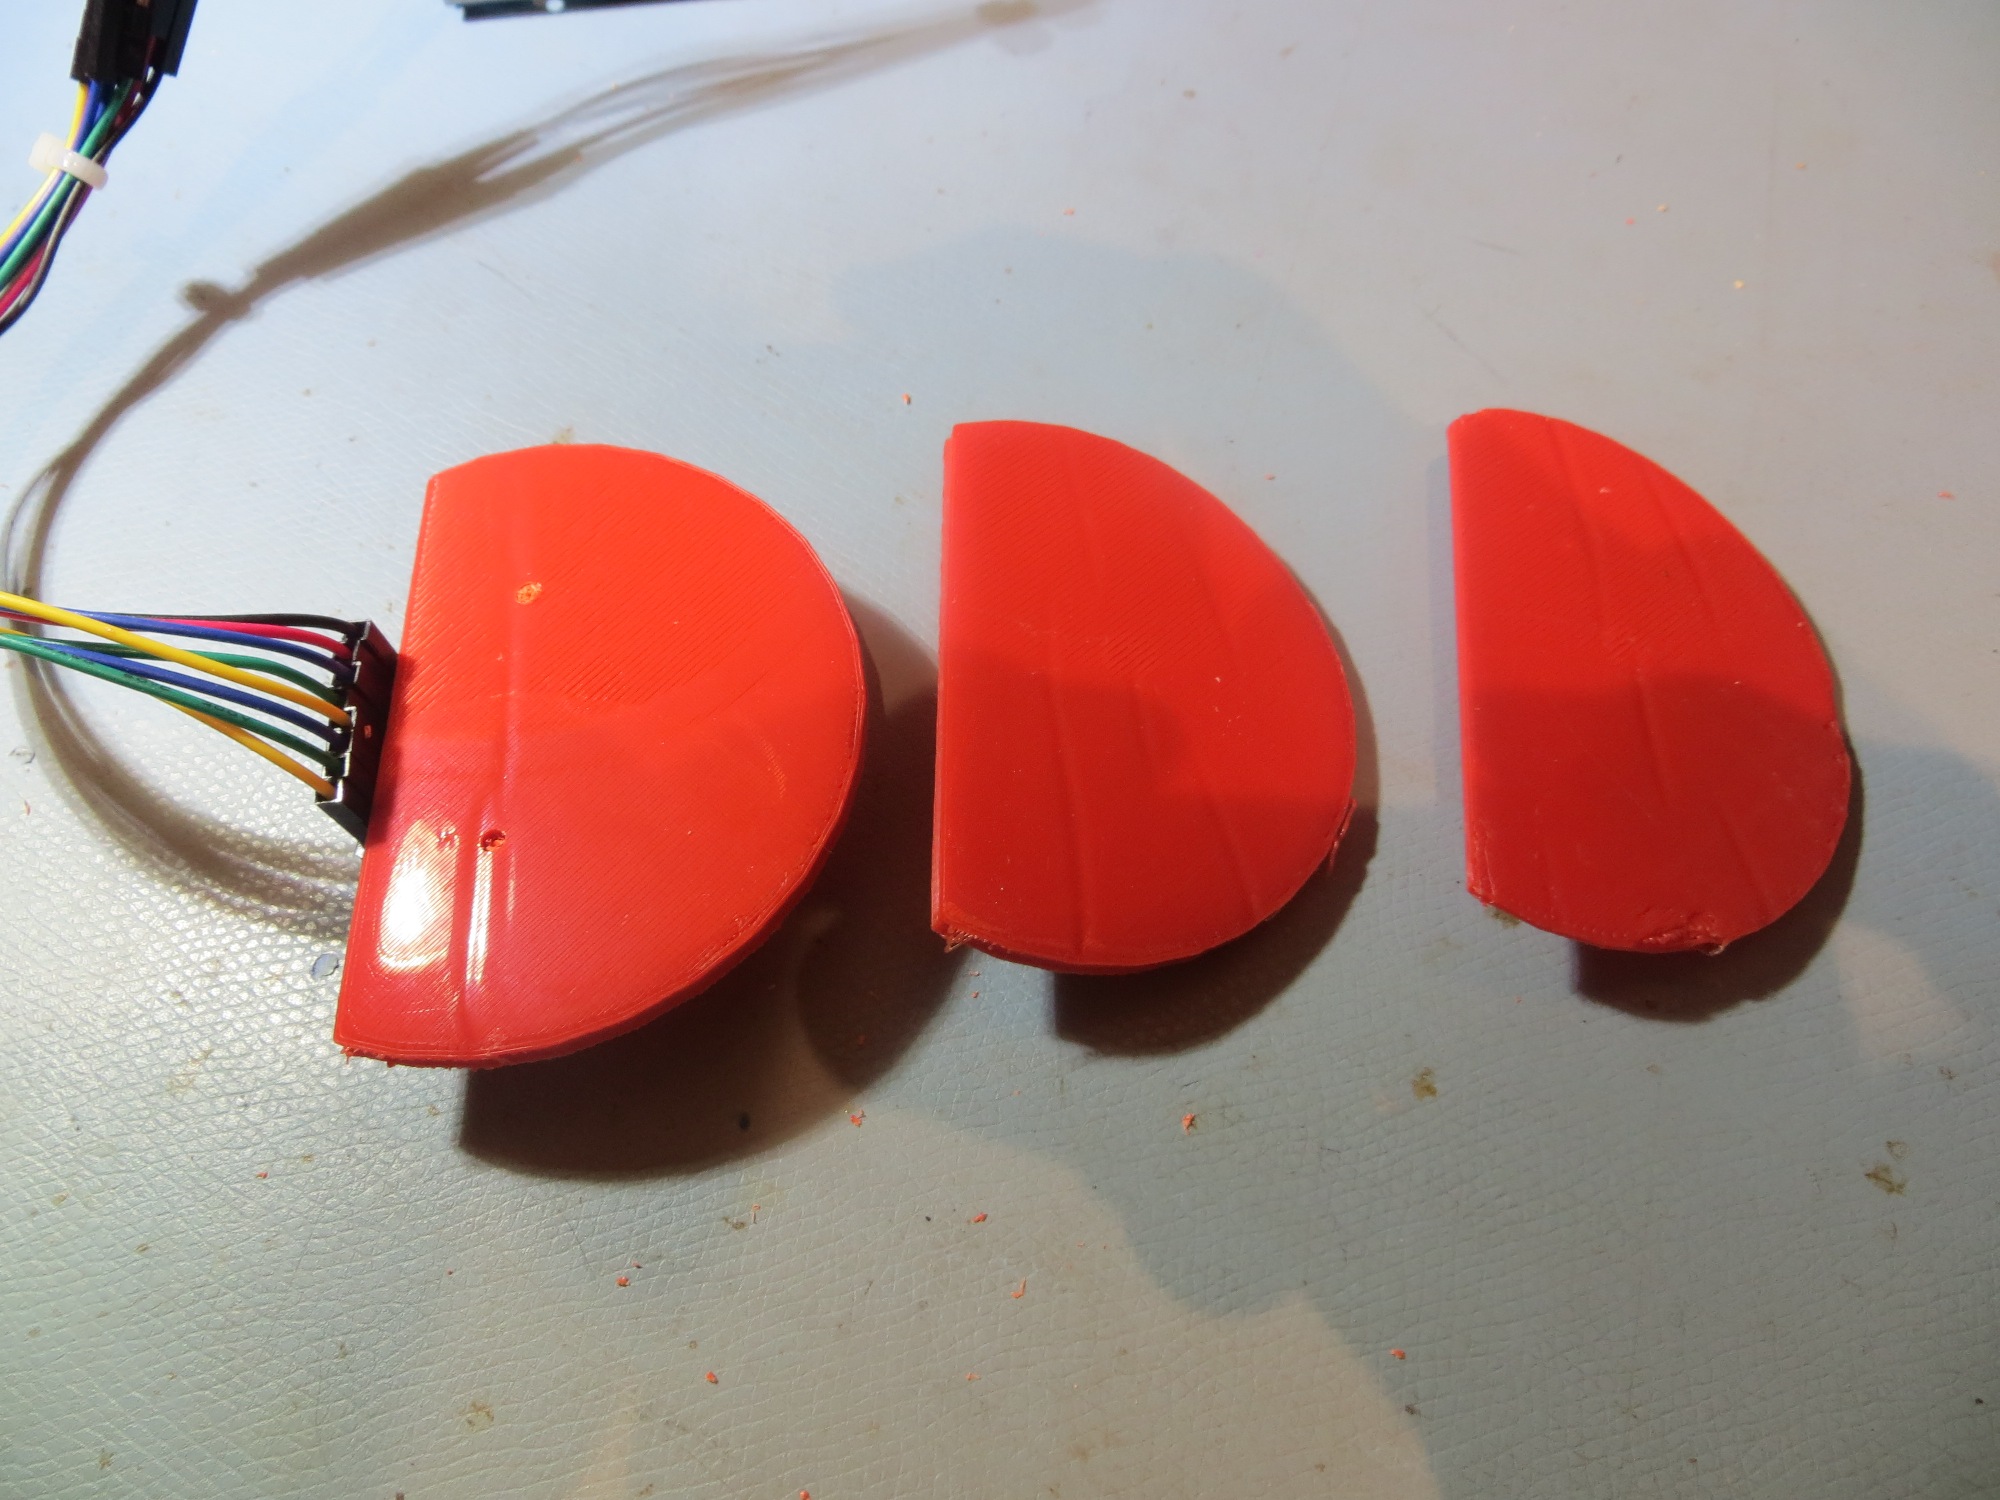
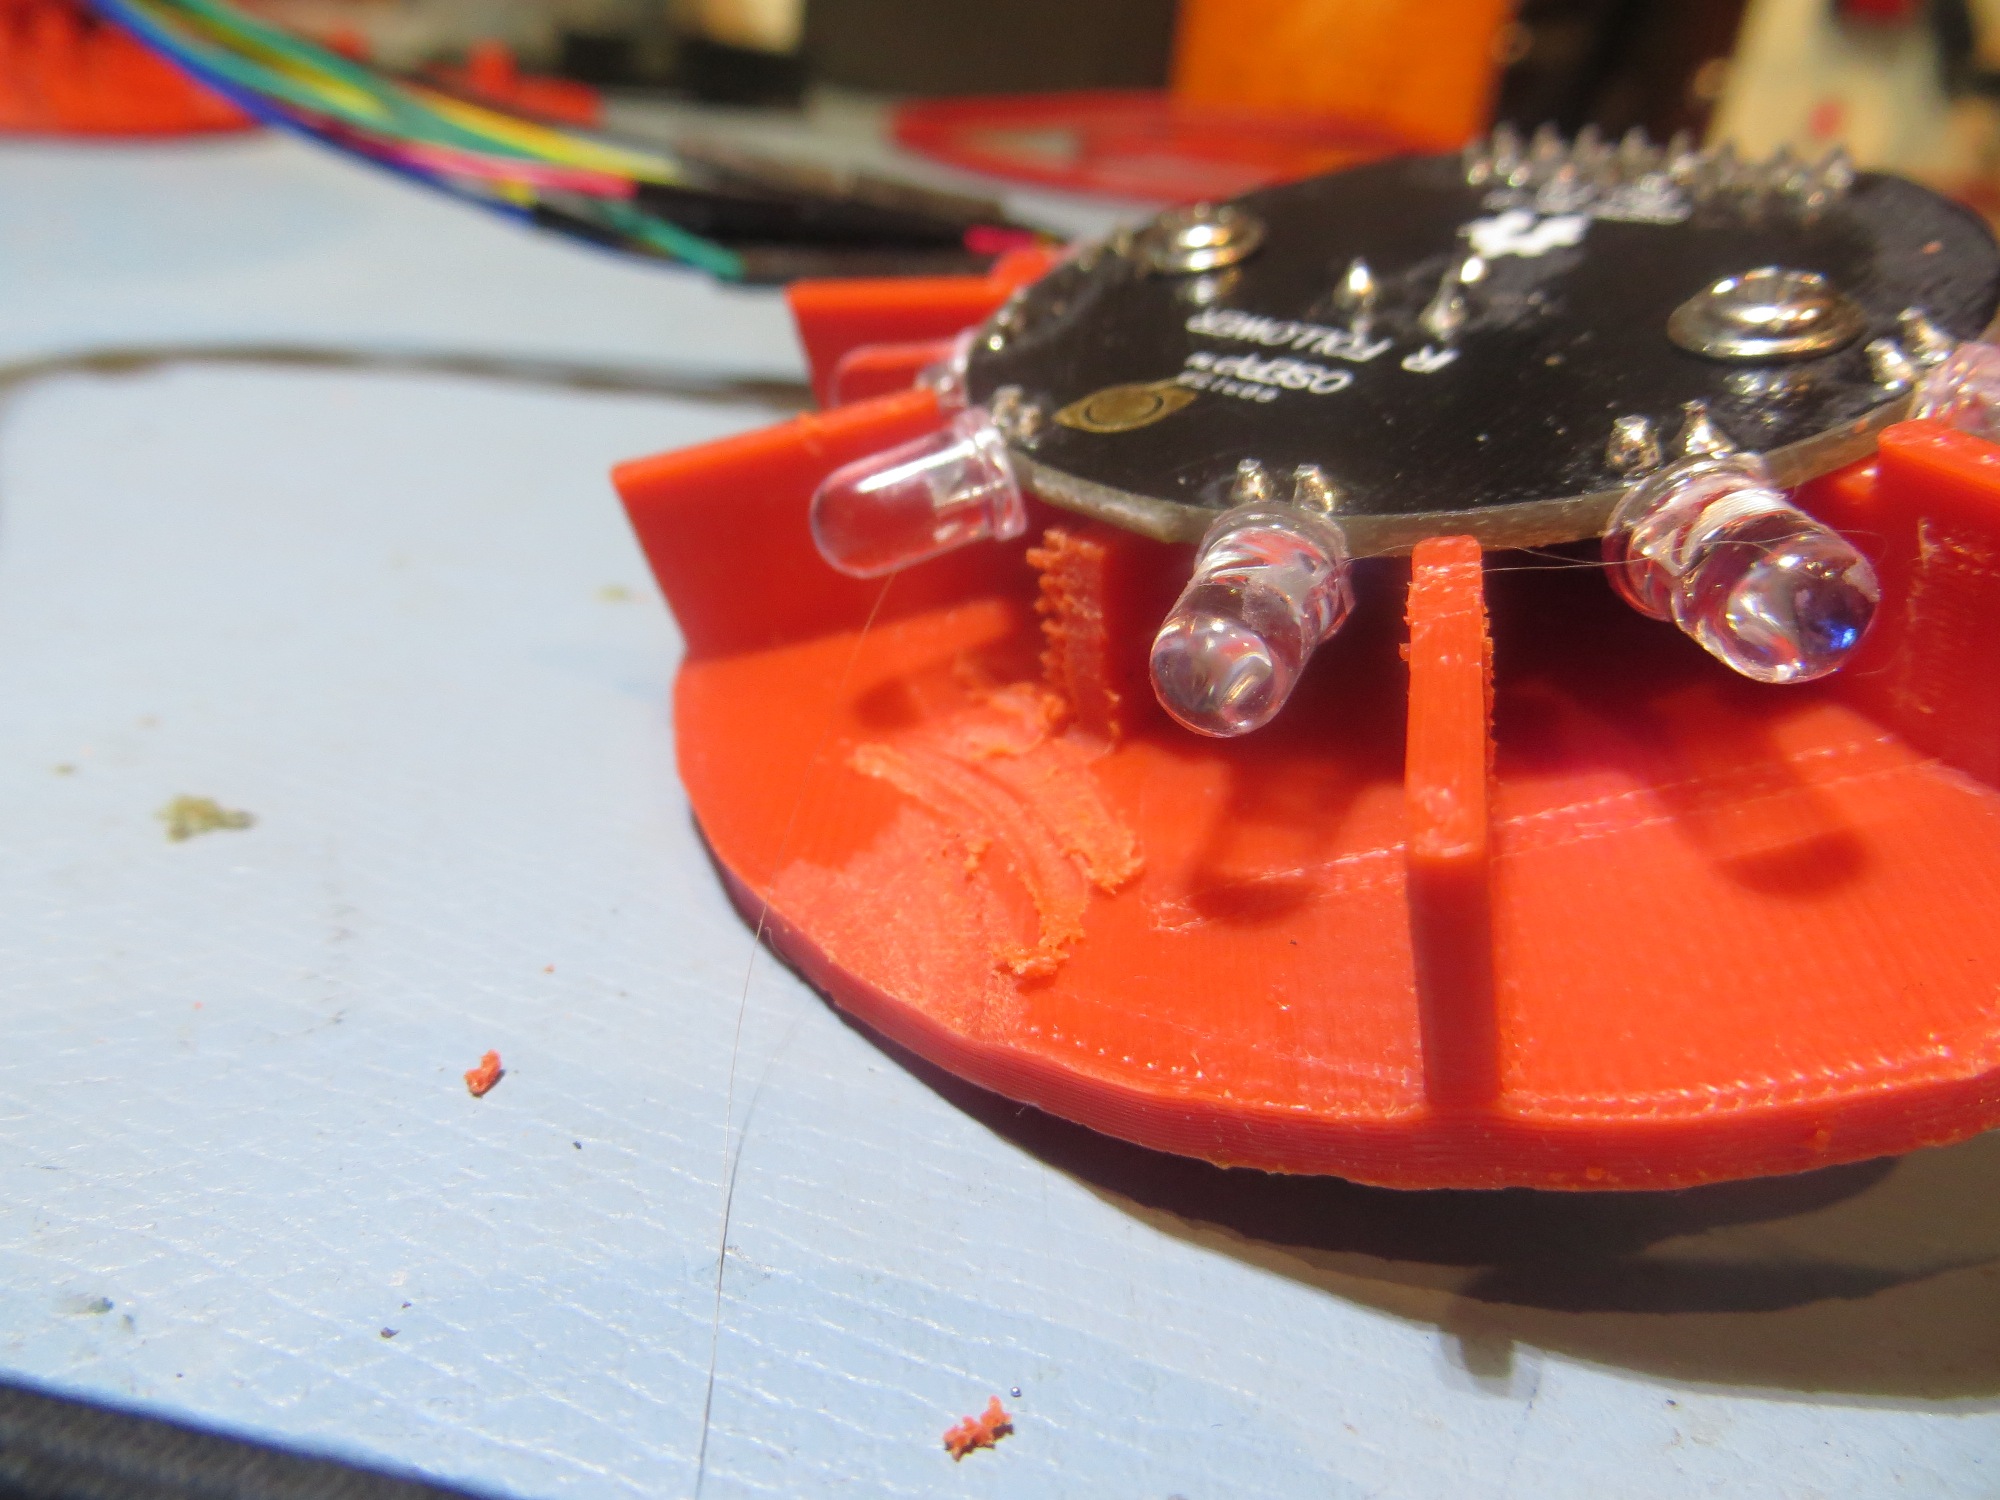
Next, I removed 8mm from the central sunshade vane, as shown in the following photo, and repeated the heading test. The results don’t vary significantly from the first one, and lead me to wonder if the vanes are actually doing anything, or it just seemed that way because they were combined with a larger overhang going from sunshade V4 to V6.
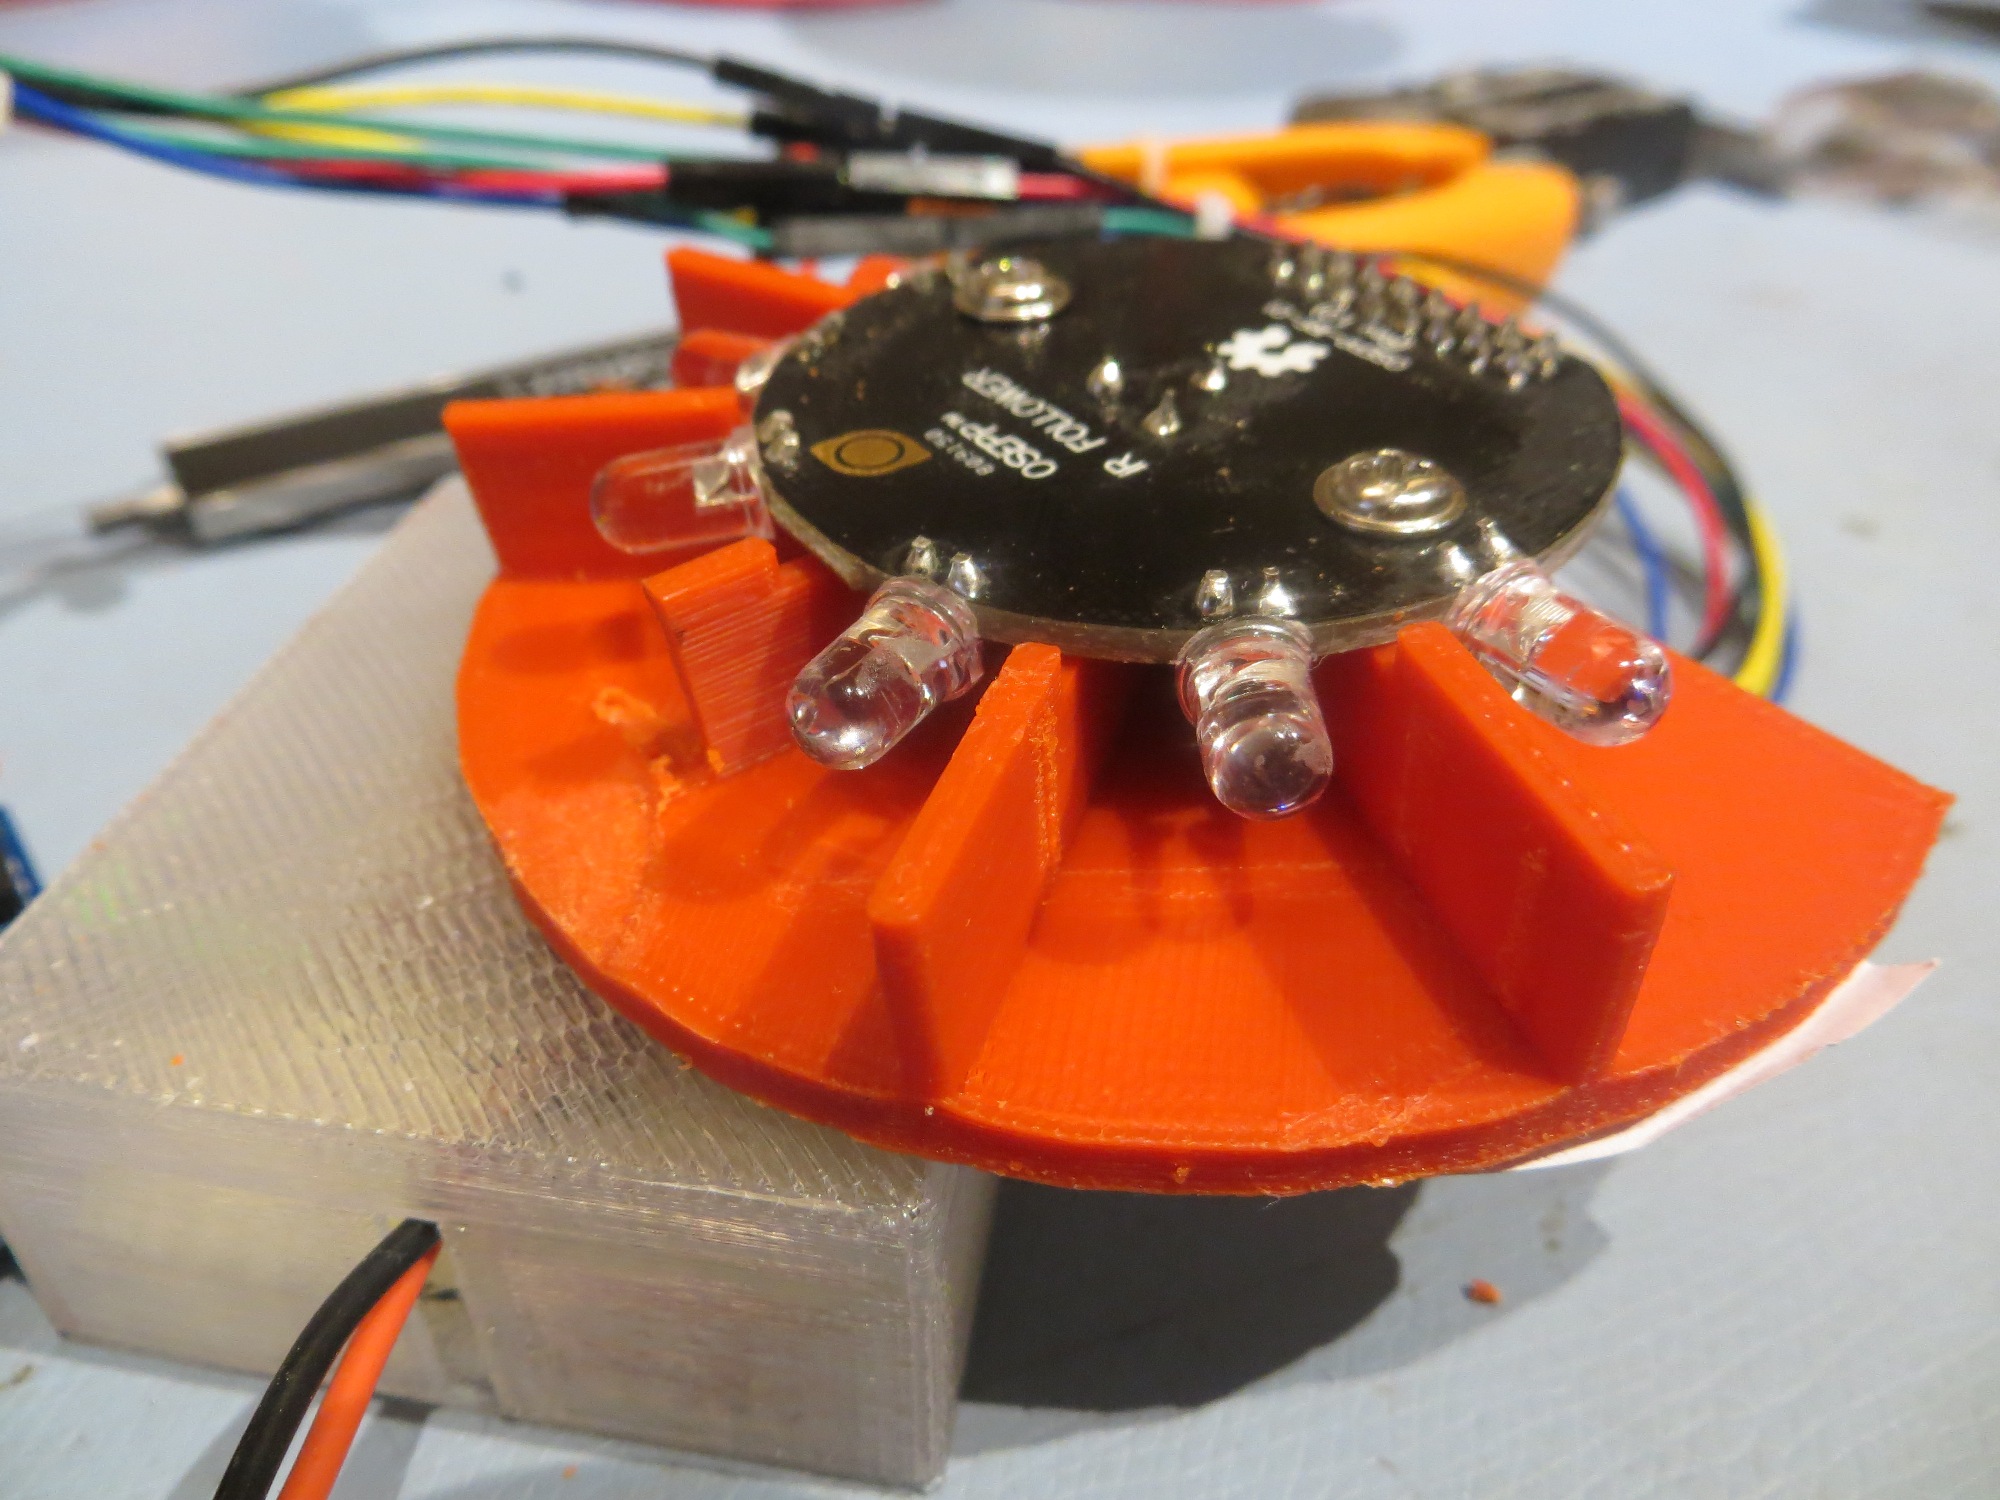
Central vane length reduced by 8mm
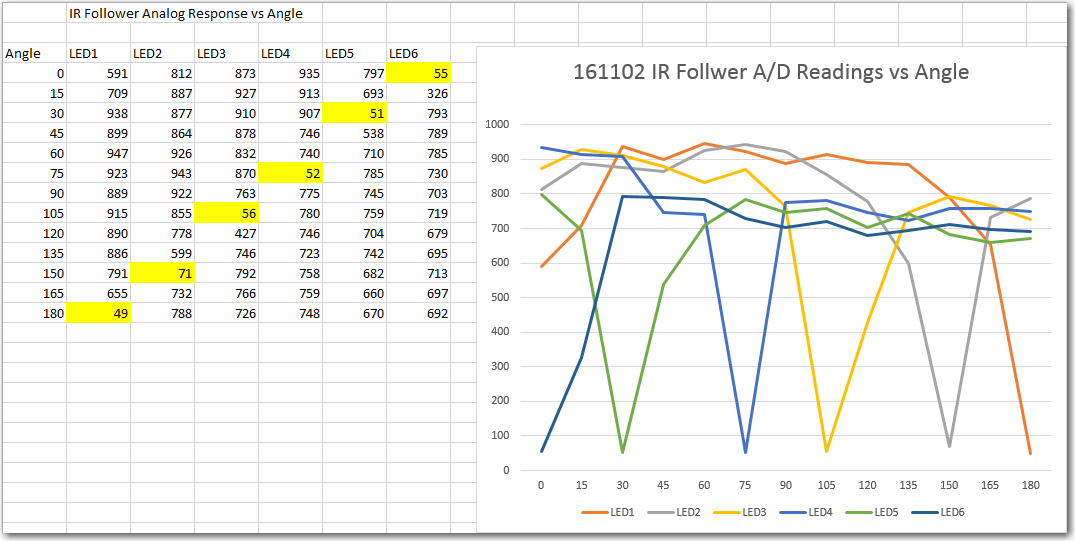
Results from second heading tests on bench-top range, with central vane length reduced by 8mm. Minimum values for each photodetector are highlighted
Since the results from the test with 8mm removed from the central vane didn’t seem to be much different from the original, I removed another 4-5 mm so the front edge of the central vane matched the outer edge of the IR follower PCB, and repeated the test, as shown below
Central vane length reduced by 12mm
Results from third heading tests on bench-top range (12mm removed from central vane). Minimum values for each photodetector are highlighted
So, it is clear from the above that at least the central vane does not significantly alter detector behavior. After this, I decided to try and determine the approximate beamwidth of each detector. For the beam-edge point, I used an arbitrary reading of 200, as shown in the following Excel table and plot.
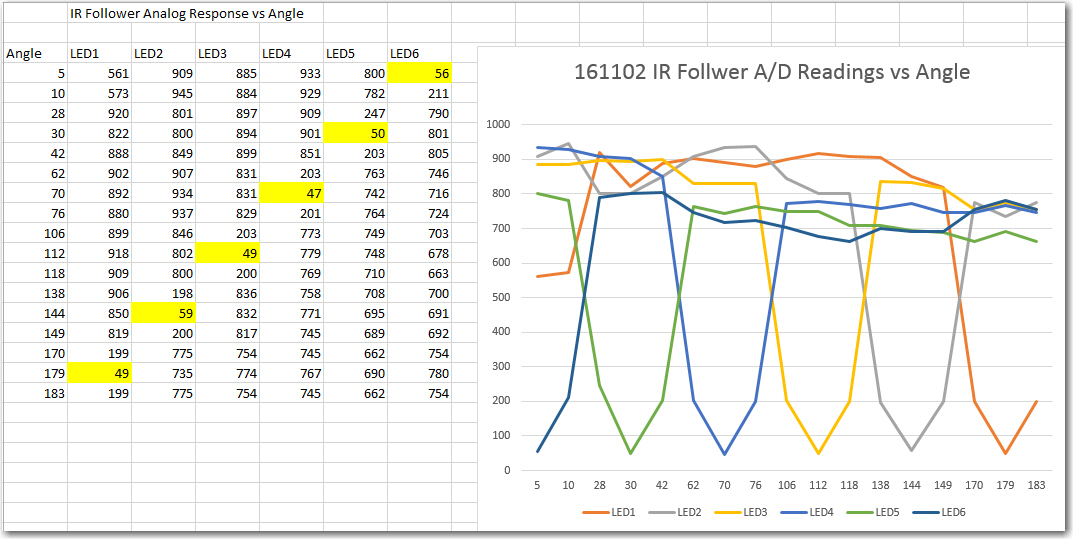
Results from fourth heading tests on bench-top range. For this test, the idea was to determine the approximate beamwidth of each detector
From the above, the approximate beamwidth for these detectors is about 10-15 deg. Since the vanes are set 36 degrees apart, they are well outside the photodiode detection angle, so that explains why removing the central vane had no significant effect. However, it does point up a potentially serious problem when attempting to use this arrangement for IR following; the photodiodes are set 36 degrees apart, with 15 degree beamwidths, so there will be a dead zone of approximately 20 degrees between each ‘live’ sector. This has two negative implications:
- My idea of mathematically blending detector readings to produce a continuous steering error term for motor drive probably won’t work, or won’t work very well
- The narrow detector beamwidth may be susceptible to multipath effects, where a narrow detector beam intersects a spurious reflection term from the IR emitter.
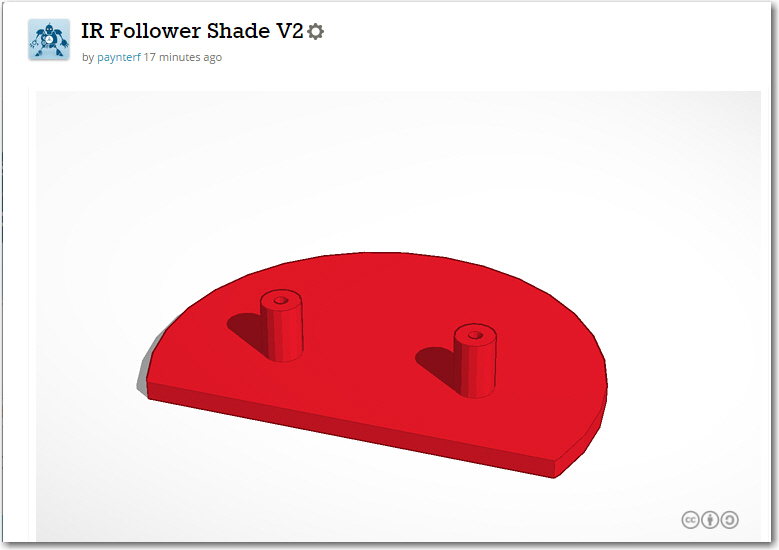
The next step is to produce another version of the sunshade with all 5 vanes cut back to the edge of the PCB, to verify that detector behavior doesn’t depend on the vanes, and to try some different IR emitters. The IR LEDs I have on hand at the moment are also narrow (i.e. 10-15 deg) beamwidths, but I have some 30 deg ones on order. Also, the current full saturation detection range is only about 20 cm, so I want to try some higher power emitters to see if I can get the range up to something practical – like 1.5-2 m.
Stay tuned!
Frank
03 November 2016 Note:
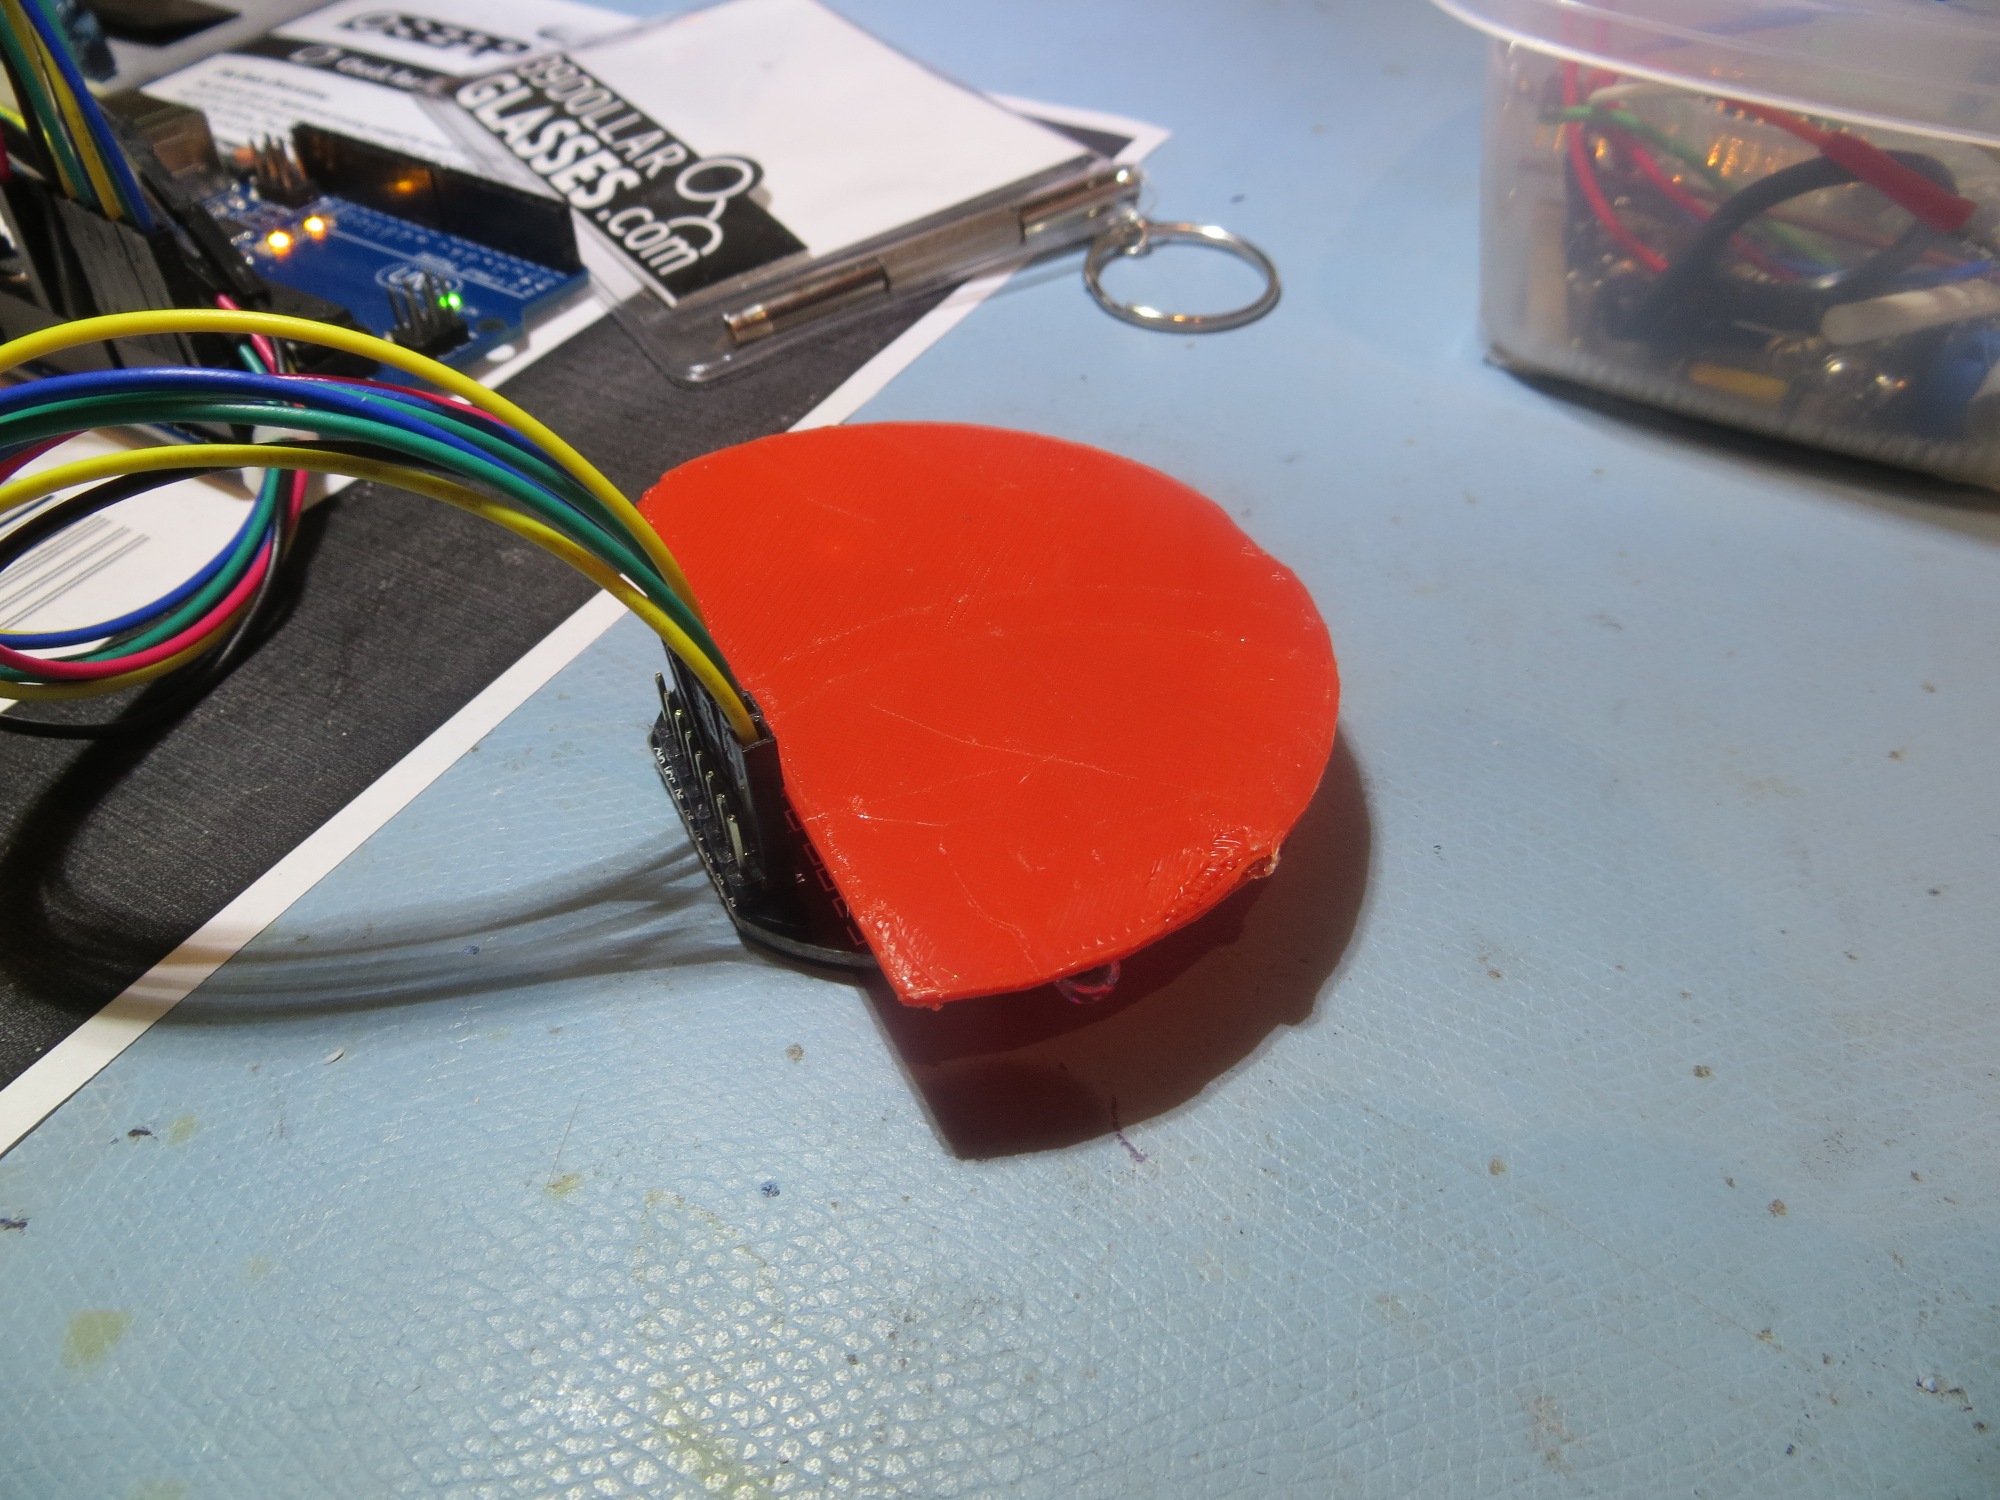
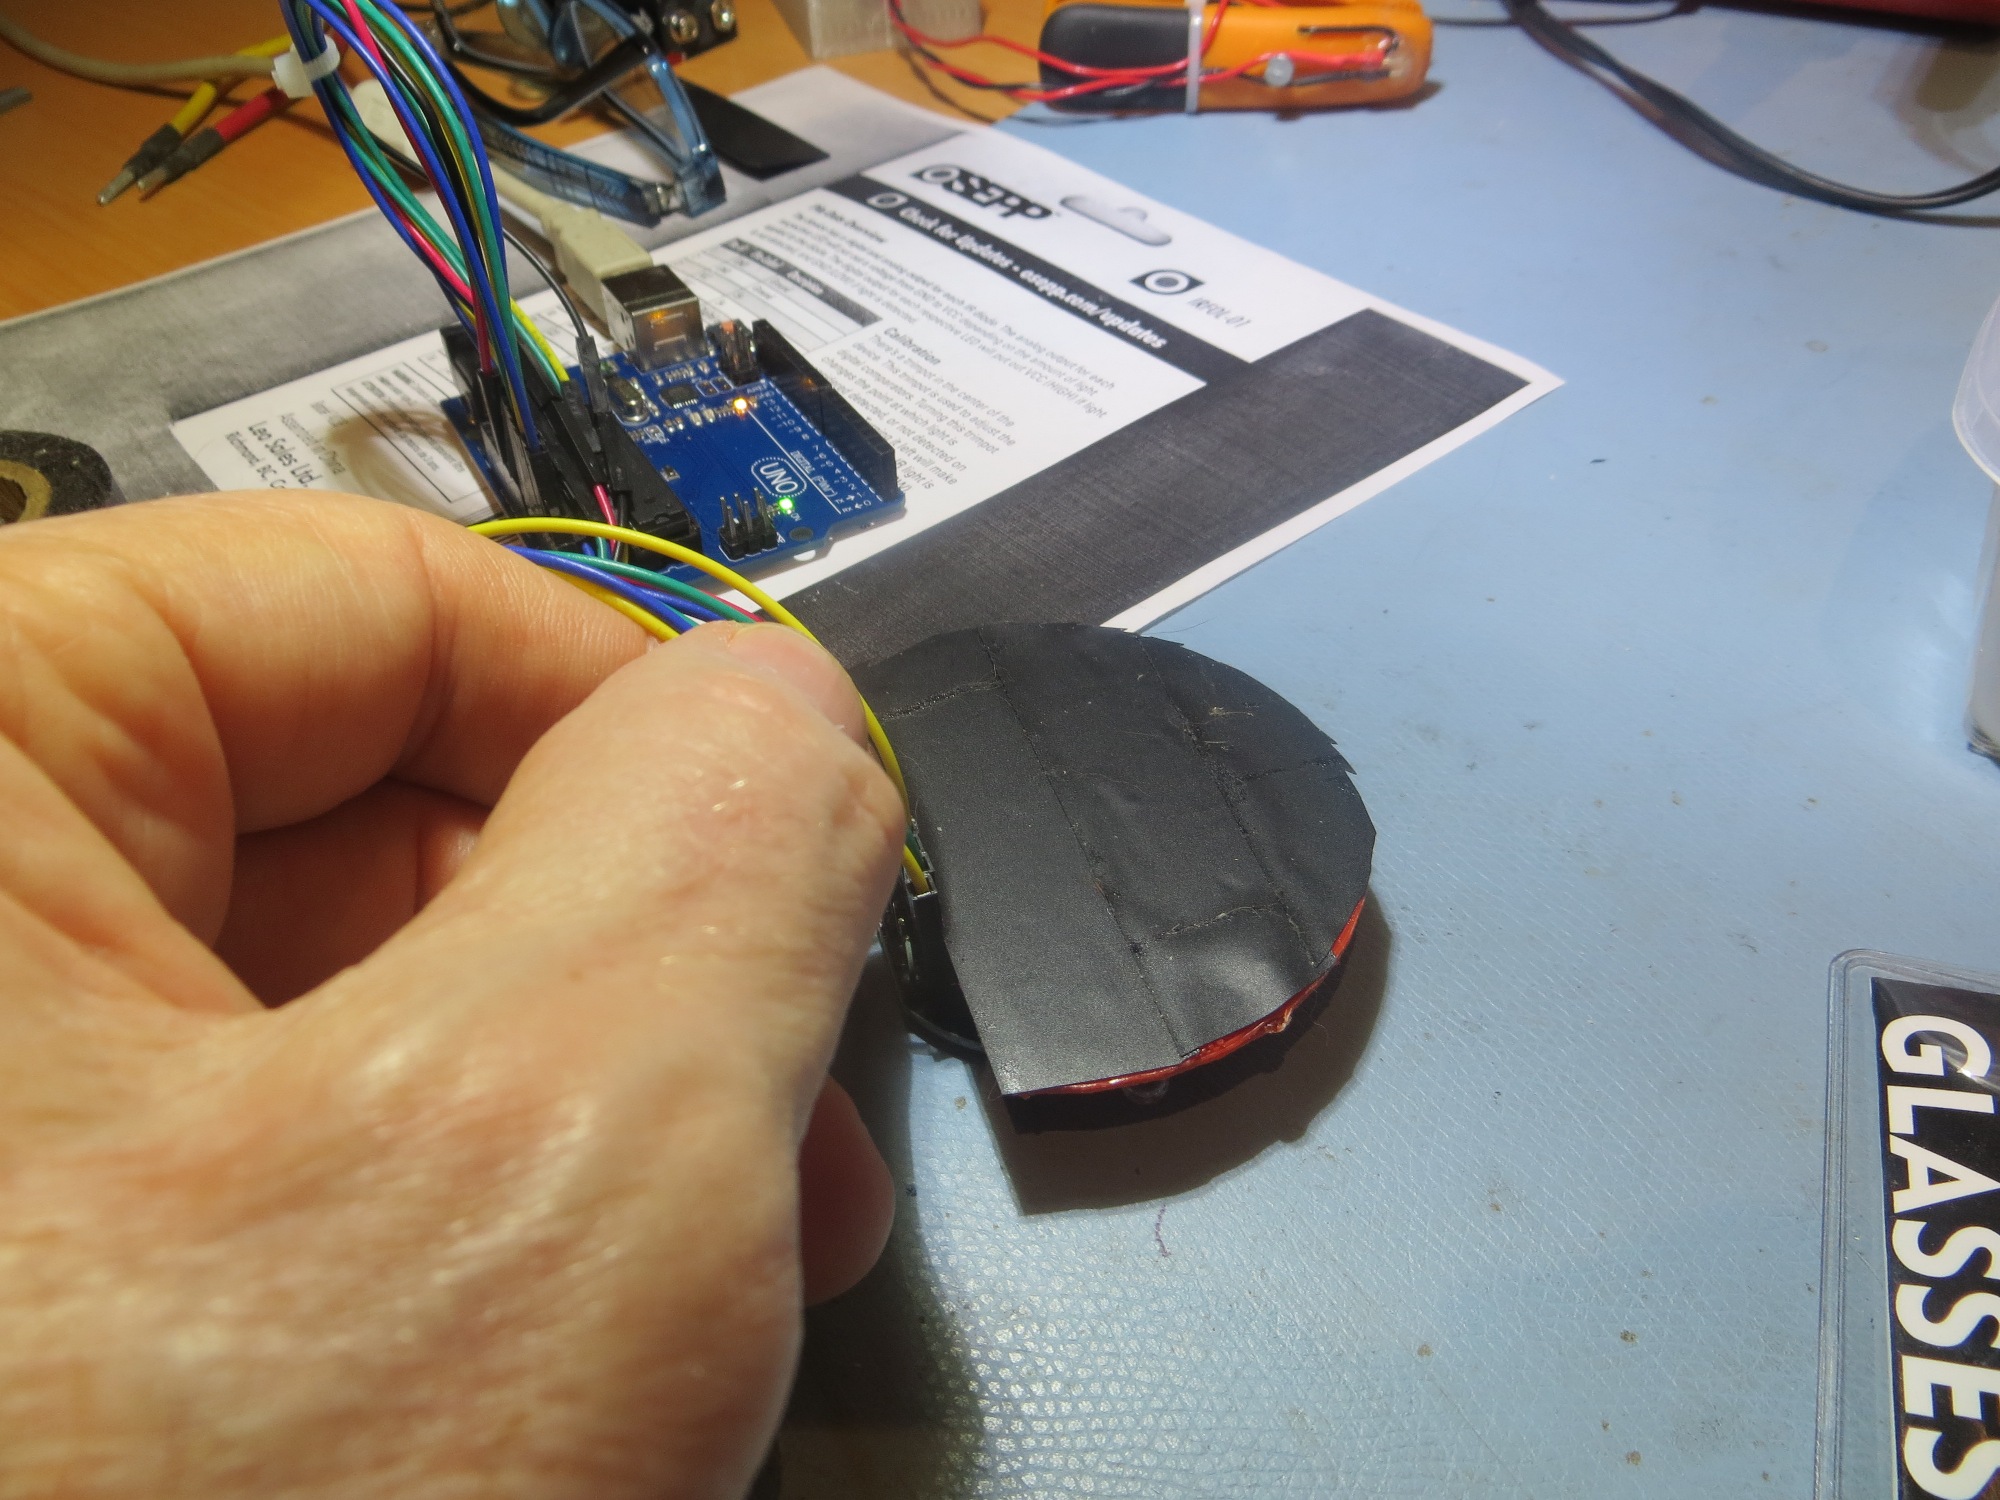
After installing the new sunshade with all vanes cut back to the outer edge of the PCB as shown below, the bench-top detector response vs angle test was performed again, with basically identical results to the previous one. This shows that the vanes aren’t needed at all, at least not the portion that extends past the edge of the PCB.
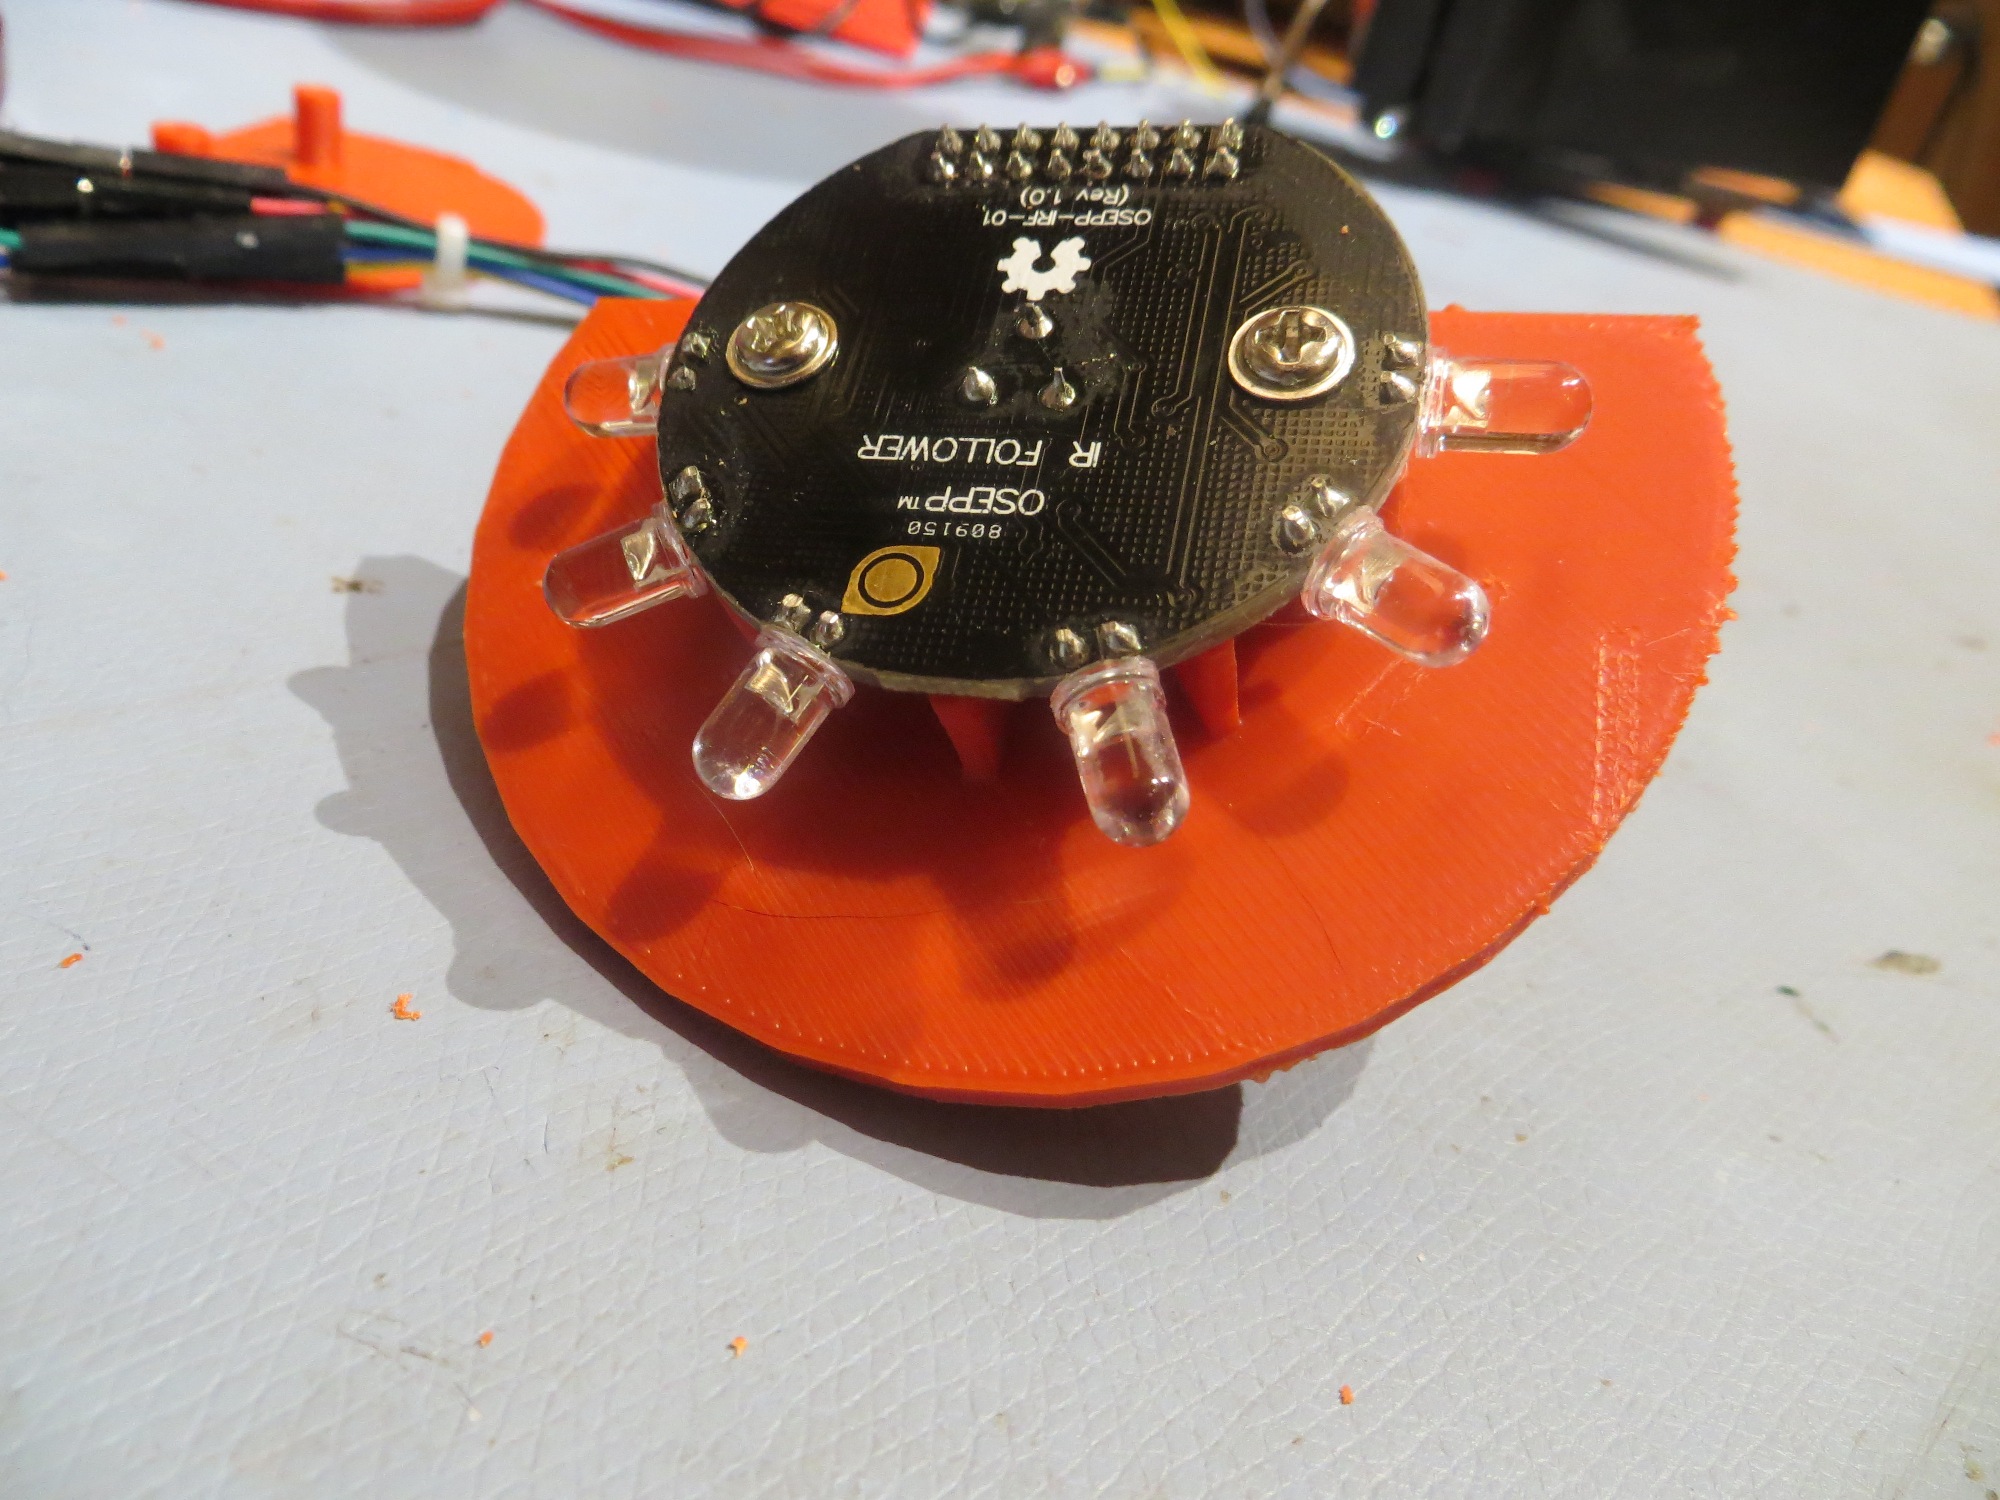
Sunshade with all vanes pared back to outer edge of PCB
04 November Note:
I acquired some Vishay TSAL6200 100mA 17 deg beamwidth IR LEDS (see spec sheet excerpt below), and ran some quick detection range tests with an LED current of about 60 mA, I was able to easily detect the IR signal at well over 1m. This distance is probably sufficient for initial detection in time for IR homing into my planned charging station, so I am reasonably optimistic that this just might come together ;-).
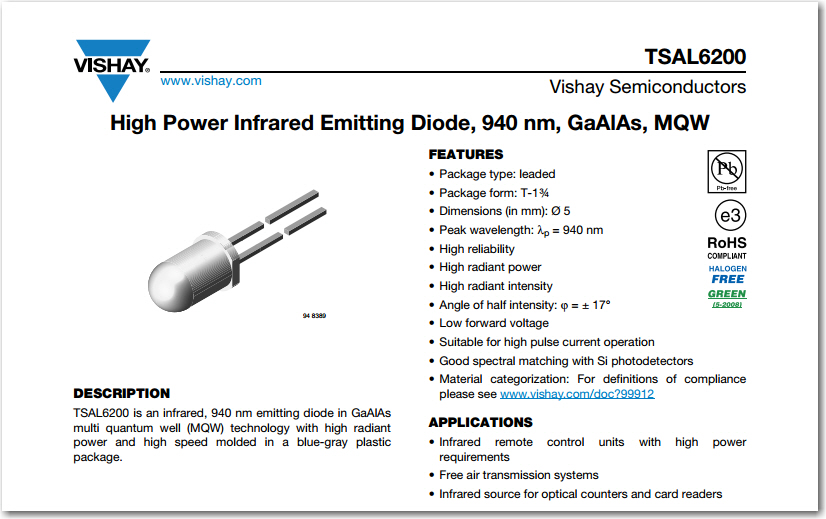
Vishay high-power IR LED. Max forward current = 100mA