Posted 20 November 2022
To study the issue of VL53L0X sensor calibration, I set up an experiment where ten measurements from each of the three right-side sensors were collected at distances from 15 – 30cm, as shown below. As can be seen, the ‘raw’ values (no correction) are pretty linear. I used Excel’s ‘trendline’ tool to display the ‘best fit’ linear expression for each line, then used these expressions to calculate a correction expression, (dashed lines)
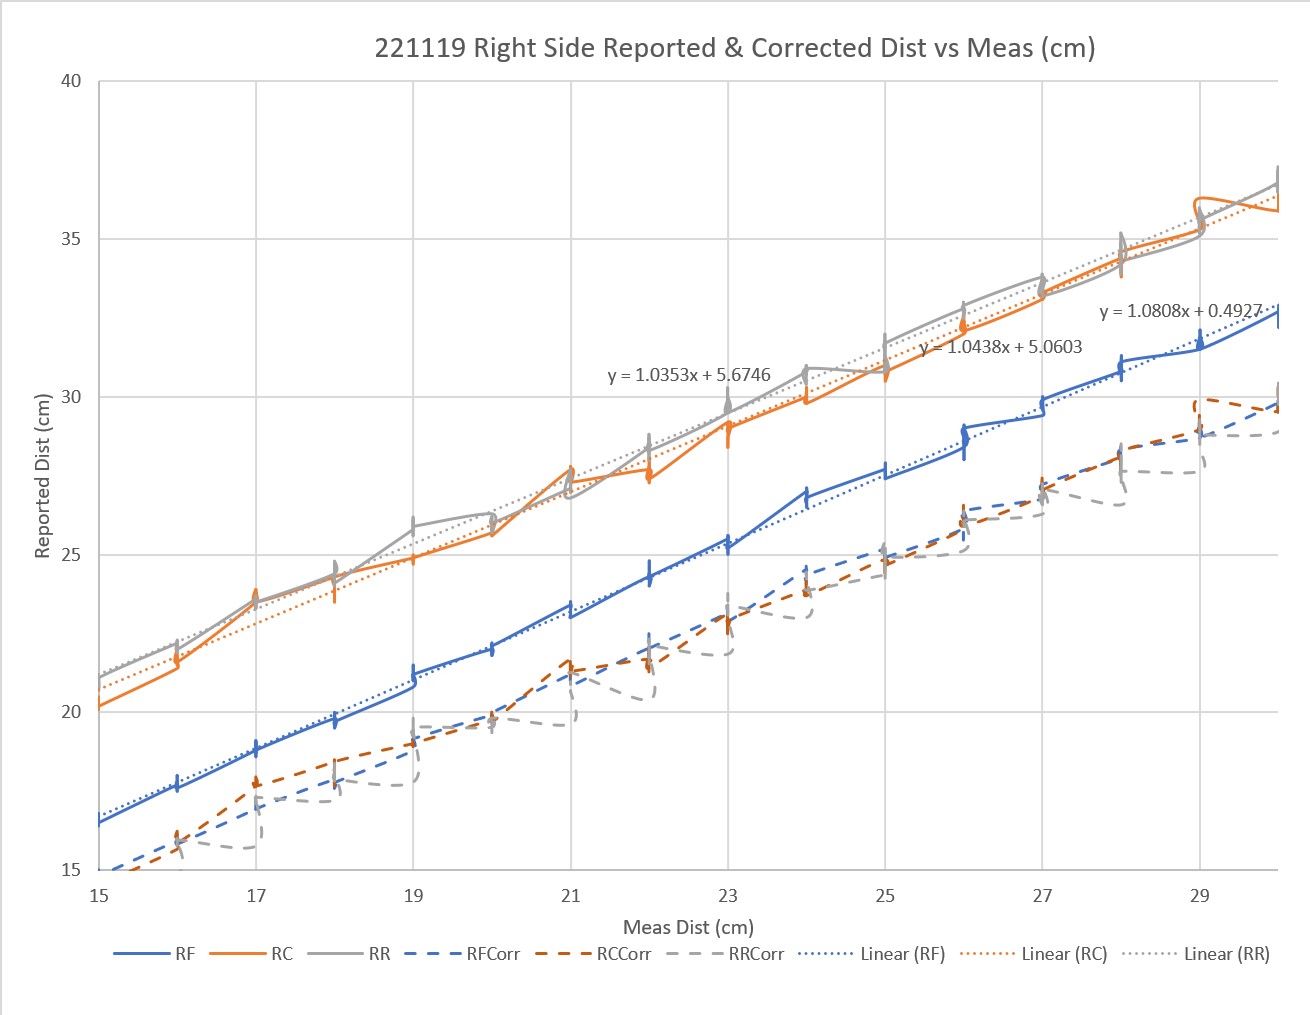
The actual correction expressions were (cm units):
- RF: RFCorr = (RF-0.4297)/1.0808
- RC: RCCorr = (RC-5.0603)/1.0438
- RR: RRCorr = =(RR-5.6746)/1.0353
Next, I edited my ‘lidar_XX_Correction()’ subroutines in my Teensy_7VL53L0X_I2C_Slave_V4 project to implement the above expressions, and made another run of distances from 15 to 30cm, as shown below.
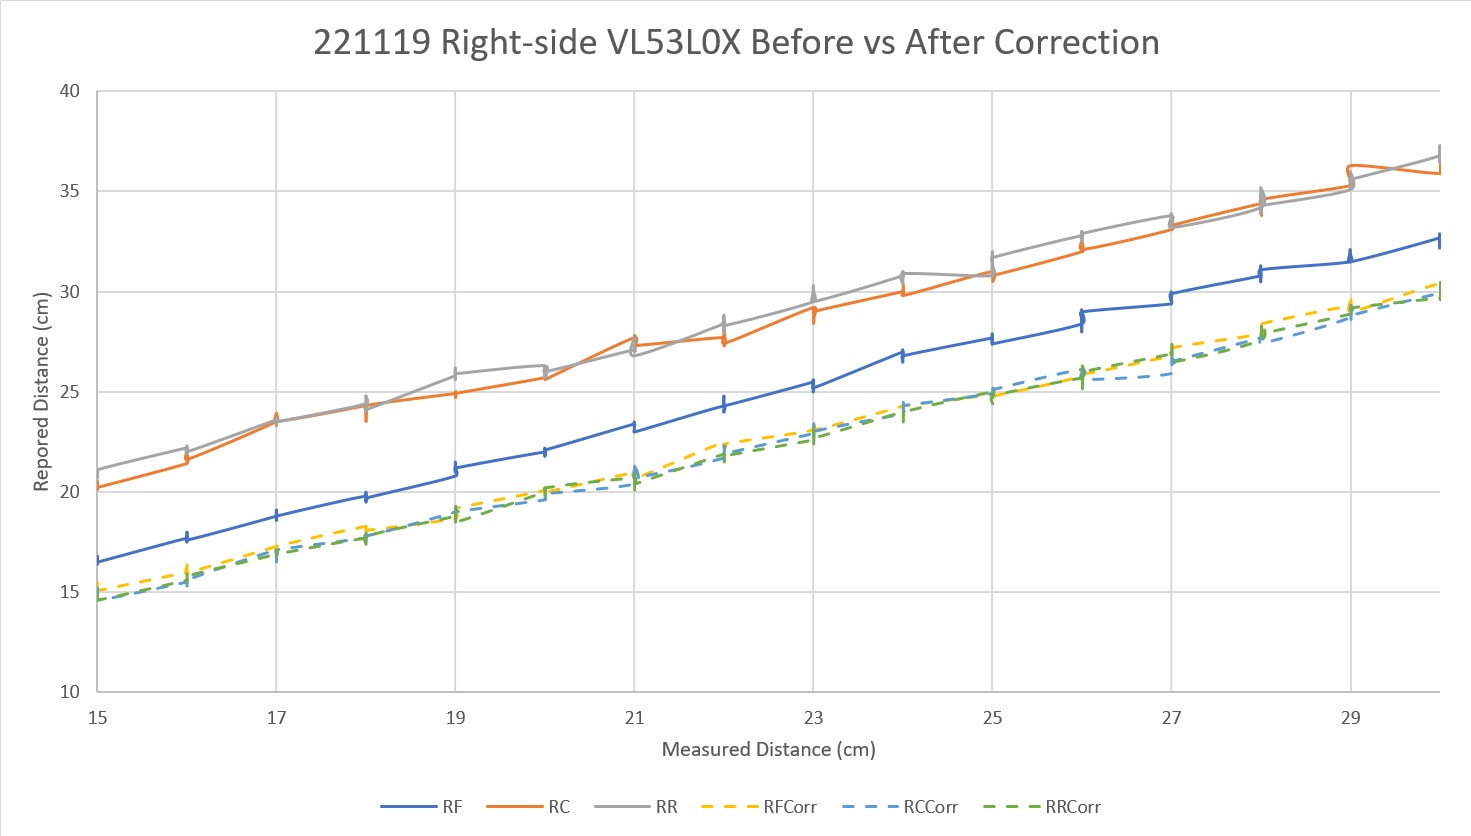
The above plot shows that the correction algorithm is effective and repeatable, at least on the right side sensors. Now I have to perform the same corrections on the left side and I’ll be all set – at least for this particular part of the ongoing Sisyphean task of educating WallE3, my somewhat retarded autonomous wall-following robot.
Applying the same methodology to the left side sensors, I first captured left-side reported distances for measured values from 15 to 30 cm, same as for the left side. Then, using Excel’s ‘trendline’ calculation feature to derive a correction expression, I added simulated correction lines to the plot, as shown below:
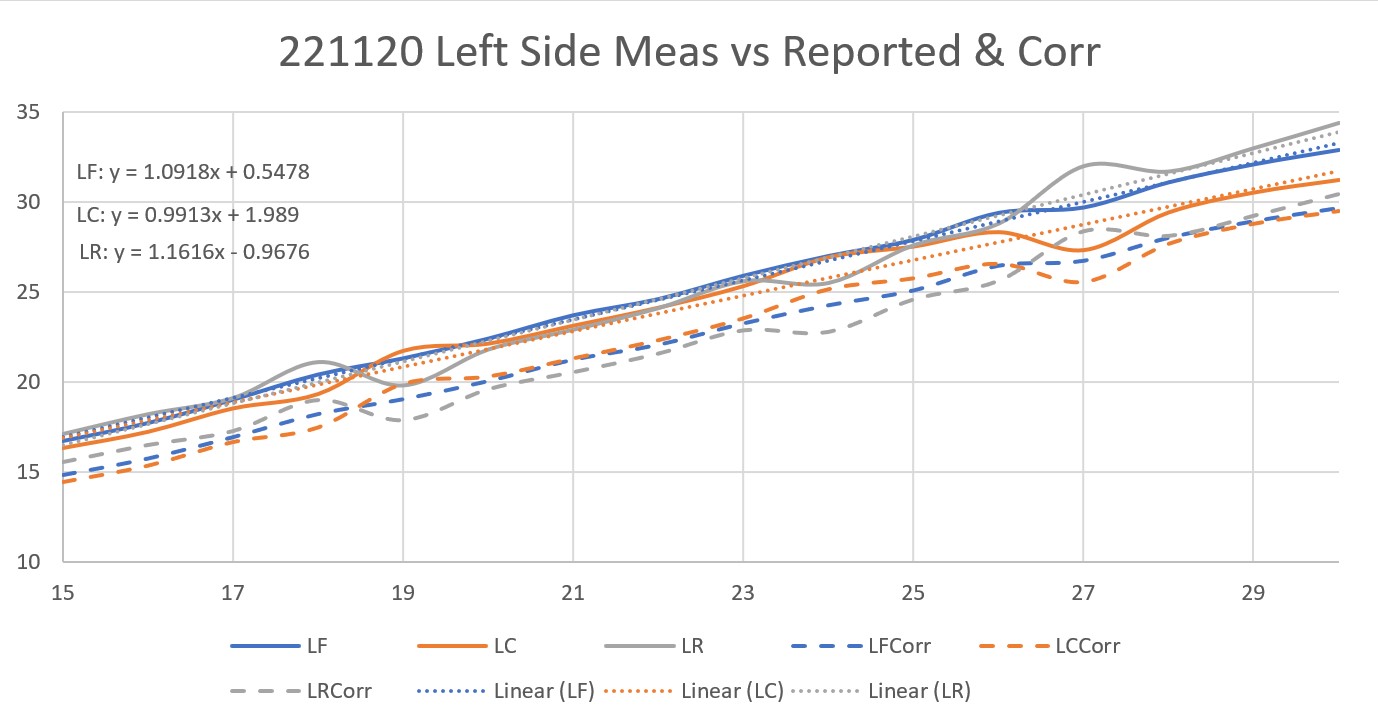
The actual correction expressions were (cm units):
- LF: LFCorr = (LF – 0.5478)/1.0918
- LC: LCCorr = (LC – 1.989)/0.9913)
- LR: LRCorr = (LR + 0.9676)/1.1616
Not much correction is needed for the left-side sensors. However, since I already have the corrections, I might as well put them in; I modified the VL53L0X sensor manager firmware to include the above corrections, and then re-did the calibration plot -this time plotting the pre-correction reported data along with the post-correction reported data, as shown below:
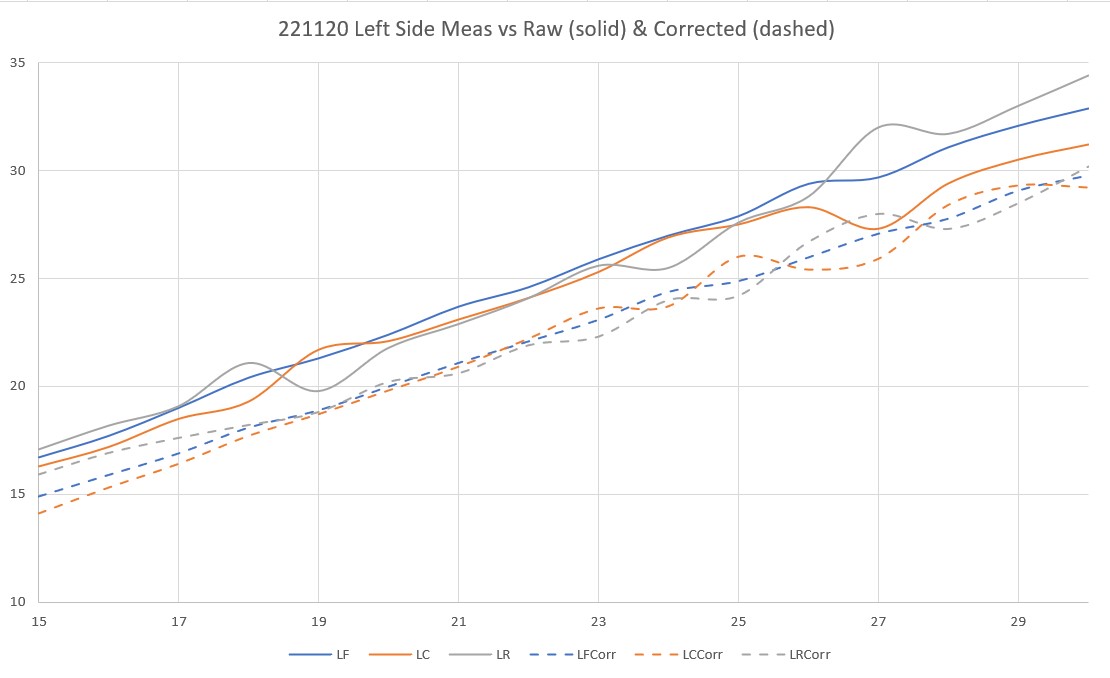
As can be seen from the above plot, left-side correction is pretty good over the entire 15-30cm range – nice!
Stay tuned,
Frank
Pingback: Improving VL53L0X Measurement Accuracy/Precision | Paynter's Palace
Pingback: Wall Parallel Find PID Tuning, Part II | Paynter's Palace
Pingback: WallE3 Wall Tracking, Revisited | Paynter's Palace
Pingback: VL53L1X Distance Measurement Compensation | Paynter's Palace