Posted 24 March 2019,
In my previous post on this subject, I described some initial wall-following tests using a PID controller, and concluded that I would have to use some sort of two-stage approach/capture arrangement to make things work properly. In addition, I needed some more ‘field’ (i.e., my hallway) testing to determine the best PID values for wall-following.
I started by causing the distance input to vary in a square wave fashion with an amplitude of about 20cm around the 50cm target value. The resulting speed variations are shown in the following Excel plot. This gave me some confidence that the basic PID mechanism was working properly.
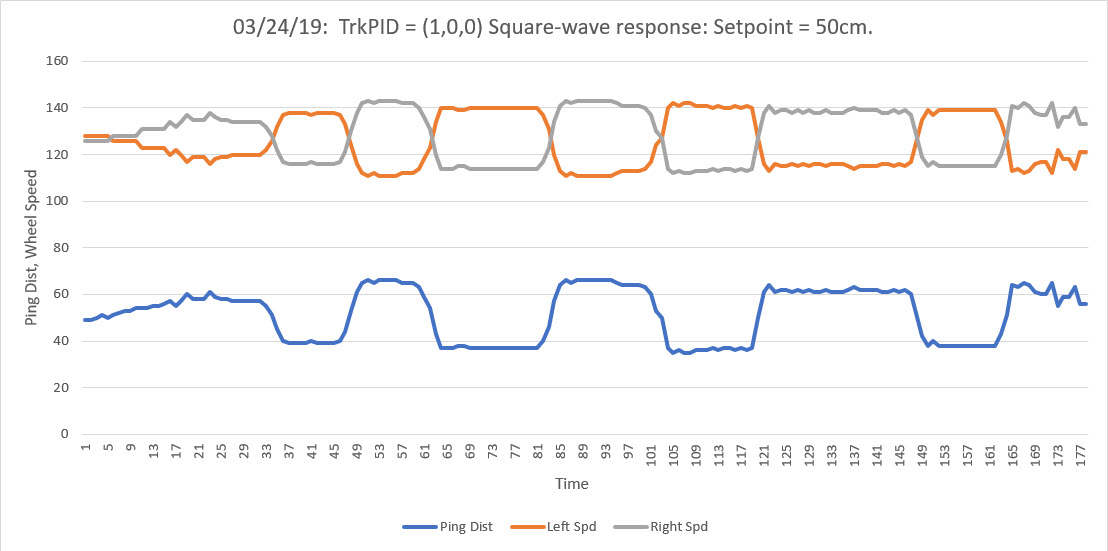
Square wave response of PID = 1,0,0
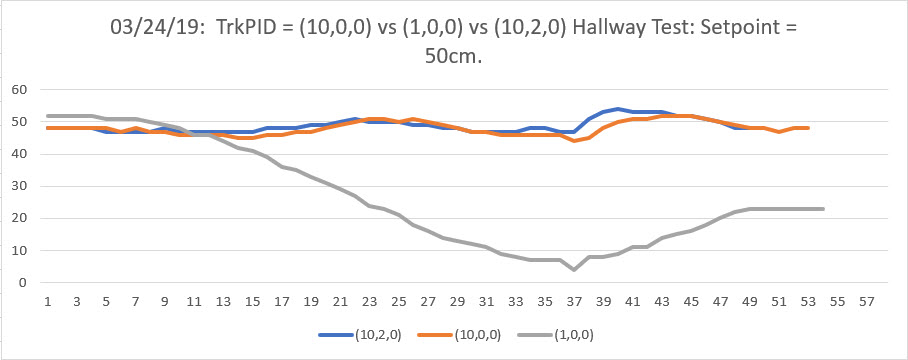
After verifying basic operation, I started field testing with the most basic values possible – PID = 1,0,0: This resulted in a very slow oscillation, as shown in the following video and Excel plot:
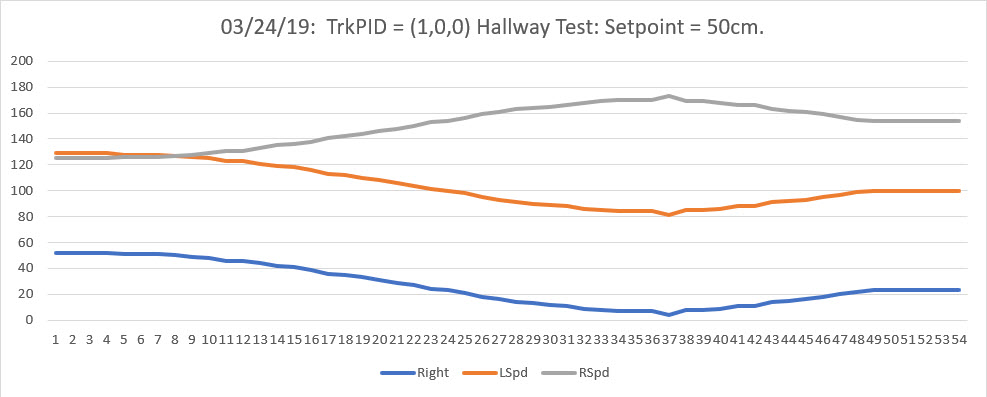
PID = 1,0,0, initial offset = target distance = 50cm
Then I moved on to the PID value I had obtained from previous field testing, i.e. PID = 10,0,0. This resulted in the behavior shown in the following video and Excel plot
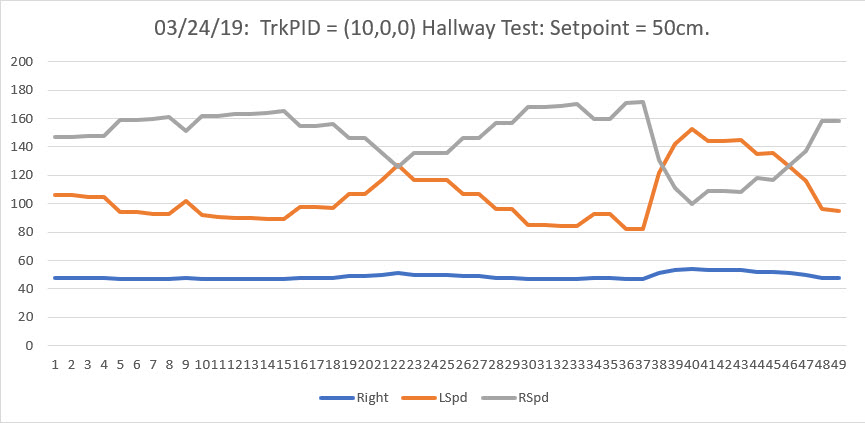
PID = 10,0,0, initial offset = target distance = 50cm
For completeness, I also tested the PID = 10,2,0 case, but as can be seen in the following video and Excel plot, this did not appreciably change wall-tracking performance, at least not for the offset = target case.
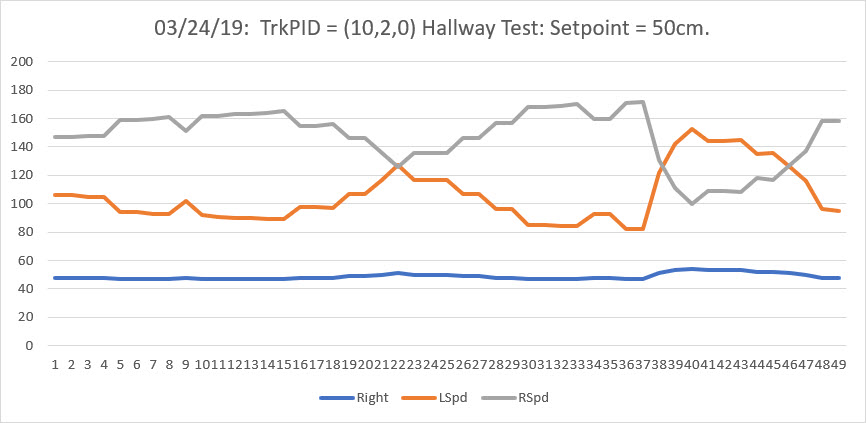
PID = 10,2,0, initial offset = target distance = 50cm
A comparison of all three PID values is shown in the following Excel plot
Next I tried the PID = 1,0,0 case with an initial offset of 25cm and a target of 50cm, to gauge how the PID algorithm performs with an initially large error term.
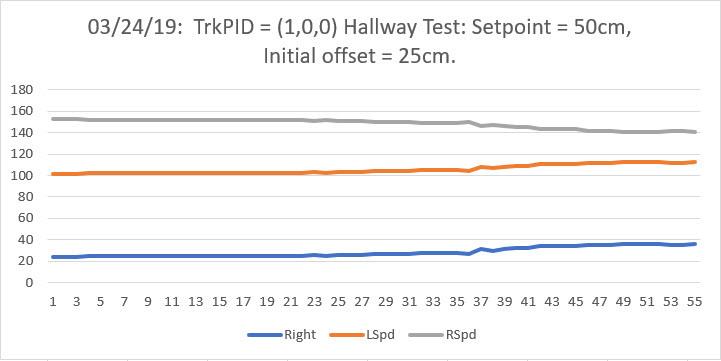
PID = 1,0,0, initial offset = 25cm, target distance = 50cm
Pingback: Back to the future with Wall-E2. Wall-following Part IV - Paynter's Palace
Pingback: Back to the future with Wall-E2. Wall-following Part IV | Paynter's Palace