Yearly Archives: 2015

Adventures with Wall-E’s EEPROM, Part III


Posted 04/19/15

In my last post I described how I might be able to use the Arduino Uno’s onboard EEPROM to see the world from Wall-E’s point of view, at least for a few seconds at a time.  So, now that I’m back home from the Gatlinburg, Tn duplicate bridge tournament, I decided to try my luck at this.

First, I had to make some additional modifications to Wall-E’s program:

  • Revised the sensor data retrieval routines to substitute  MAX_FRONT_DISTANCE_CM for any zero reported from either  front sensor, and to substitute MAX_LR_DISTANCE_CM for any zero reported from either the left or right sensor. This takes care of the problem of sensor readings abruptly transitioning from a near-maximum reading to zero, and back again.
  • Revised the EEPROM storage routine to store readings from all four sensors instead of just the two front ones.  Data will be recorded until the EEPROM is full, at which point Wall-E will blink all four taillight LED’s twice.  Wall-E will continue to run, but won’t store any more data.
  • Revised the separate EEPROM readout program to properly read out all four sensor values, instead of just the two front ones.

After making the modifications (and fixing the inevitable bugs), I set Wall-E loose on the world with it’s new EEPROM-storage capabilities.  I video’d the run so I would later be able to correlate the EEPROM data with what Wall-E was actually doing at the time.  The first run went very well, with Wall-E behaving ‘normally’ (whatever ‘normal’ means for a robot!).  I videoed the run until Wall-E blinked its tail-lights to signify it was done recording, and I noted that the run had lasted about 30 seconds (which was too bad, because Wall-E got stuck on a coat rack leg  just after running out of storage space! ;-).

The video and the Excel plot are shown below, followed by my post-run analysis


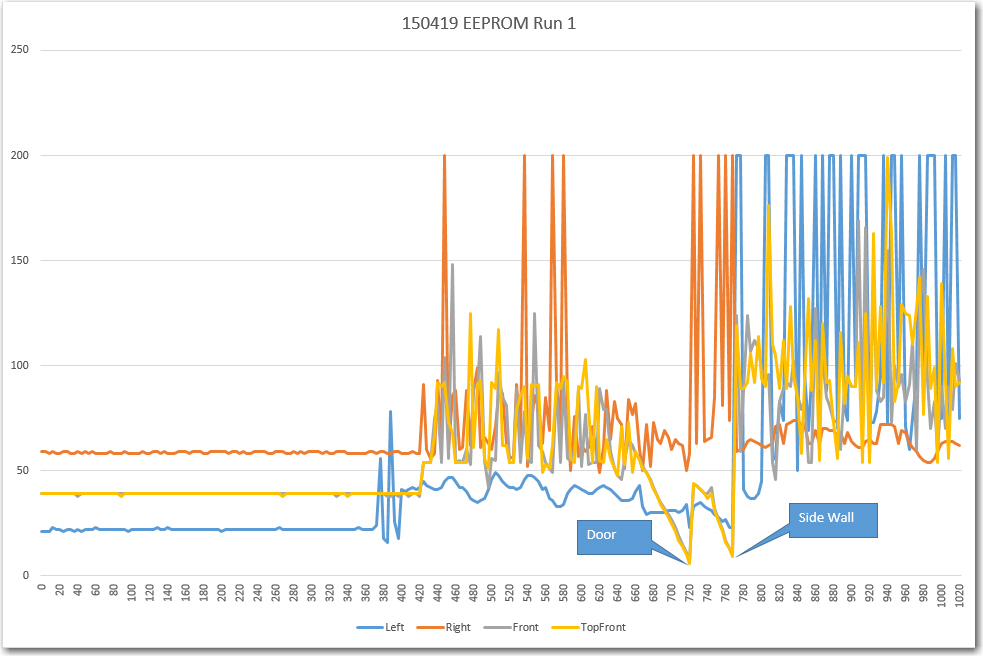
EEPROM data from Wall-E's first instrumented run

EEPROM data from Wall-E’s first instrumented run

Analysis:

  • The very first thing I noticed about the Excel plot is that there is something badly wrong with the first part  of the data,  up to about point 400; it’s way too constant.    After about 400, it looks like Wall-E collected ‘good’ data, although a lot of it looks pretty frightening!
  • I thought Wall-E started out tracking the wall on the right, but the data doesn’t support that – it appears it was tracking on the left wall from the get-go.
  • from the video it looks like Wall-E’s tracking period is between  one and two seconds, and from the plot this corresponds to about 50 points.  This correlates reasonably well with the observation that it takes about 30 seconds to fill the 1024-byte EEPROM.  1024 divided by 30 gives 34 points/sec, so 50 points would give a period of about 50/34 = 1.5 seconds.  This is actually quite good news, because it means that the 50-point array I was using earlier as part of the ‘stuck’ detection routine can probably capture an entire tracking period.  The amplitude of the tracking response appears to be about 8-10 cm in ‘free space’ and about half that when Wall-E’s castering nose wheel was hitting the rug edge after about point 580.
  • From the plot, it appears the front and top-front sensors were reporting obstacles in view even though there weren’t any, at least not for the first part of the initial wall-tracking phase of the run.  This is probably due to the fairly large heading deviations made by Wall-E even while wall tracking, possibly coupled with some multipath effects.  This is actually good news as  there should be significant variation in front sensor readings during normal operation, even if there is no dead-ahead obstacle within sensor range.   Also, it is clear that once Wall-E  came within about 60-75 cm of the door, it ‘captured’ the attention of both the front and top-front sensors, which then tracked the door very nicely all the way down to the 10 cm avoidance threshold.  The same thing happened with the side wall, although because Wall-E was moving slower, the distance reversal happened a bit earlier.
  • After turning away from the side-wall obstacle, Wall-E tracked the same wall, but in the opposite direction and at a larger distance (about 60 cm vs about 40 on the way in).  It is interesting to note that the reported distanced from the front sensors also went up, presumably due to the longer slant-distance to the wall and back during the toward-wall heading excursions (and also probably because Wall-E’s heading excursions weren’t as large due to being slower on the carpet)
  • The ‘off-side’ (right sensor on the way in, and left sensor on the way out) showed very large variations – large enough to hit the stops (200 cm max distance) occasionally on the way in, and on almost every heading swing on the way out.  The measured distance from Wall-E’s average position on the way out to the far wall is about 150 cm, so a 45 degree heading variation would create a slant range distance of over 200 cm.  Smaller heading deviations would also likely create a situation where most of the  left sensor’s ping energy bounced away from the sensor, creating a ‘nothing in view’ response.

Posted 04/20/15

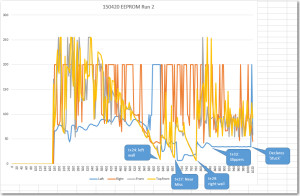
Today I made another run with the EEPROM enabled.   This time I was fortunate enough to have Wall-E encounter my wife’s stealth slippers, while still in the EEPROM collection window, so I may have captured that data.  Unfortunately, Wall-E was uncharacteristically smart enough to figure out he was stuck, and so backed away from the dreaded robot-eating slippers!


Sensor plot from Run 2. Wall-E triumphs over the ‘stealth slippers’ at the end!

Analysis:

  • This plot shows the same disconcerting initial section where the data just doesn’t look correct.  However, this time I know where it comes from; Wall-E’s normal running code is configured (now – not for Run 1) to zero out the EEPROM contents before the run starts, and this happens in setup().  When I want to read the information back out again, I need to load an entirely different program, and to do that, I have to connect the USB connector to the Arduino.  Unfortunately, this action also powers up the Arduino and sets Wall-E’s normal program running – and practically the first thing it does is start zeroing out the EEPROM.  Fortunately it only got through the first couple of hundred data points before being halted by the bootloader, but this is the reason for the initial group of zeros in the plot for Run 2, (and the initial group of too-stable data for Run 1).  In the future, I think I’ll incorporate a switchable delay  into Wall-E’s programming, maybe using the now-existing pushbutton, so that no data will be zeroed out or overwritten.
  • Between point 336 and 358 the front and top-front sensor readings ‘come off the stop’ of 250 cm as they start ‘seeing’ the doorway at the end of the hall.
  • T + 24: Wall-E hits the wall to the left of the doorway at point 628 after a hard left turn, and immediately backs up and recovers.  The hard left turn occurs when Wall-E’s right sensor picks up the short wall stub to the near right and then, after making an initial correcting left turn, picks up the door itself and ‘wall-follows’ it.  This is clearly shown in the data, as the right sensor (red) readings drop below the left ones at that point.  Wall-E is programmed to use the nearer wall for wall-following.
  • T + 27: Wall-E barely misses the end of the short wall stub.  It has been  ‘wall-following the door and then short wall on its left side this entire time.  Interestingly, between the t + 24 hit and this  near miss, the top-front sensor readings vary wildly, but the front sensor ones look fairly smooth.  My guess is that the upper sensor was alternately ‘seeing’ the wall stub approaching and the wall well beyond that point, while the lower one was just getting the wall stub.
  • T+ 29: At point 684, Wall-E hits the other wall and recovers.
  • T + 33: After recovering from the second wall hit, Wall-E runs into the stealth slippers and gets stuck – yay!!
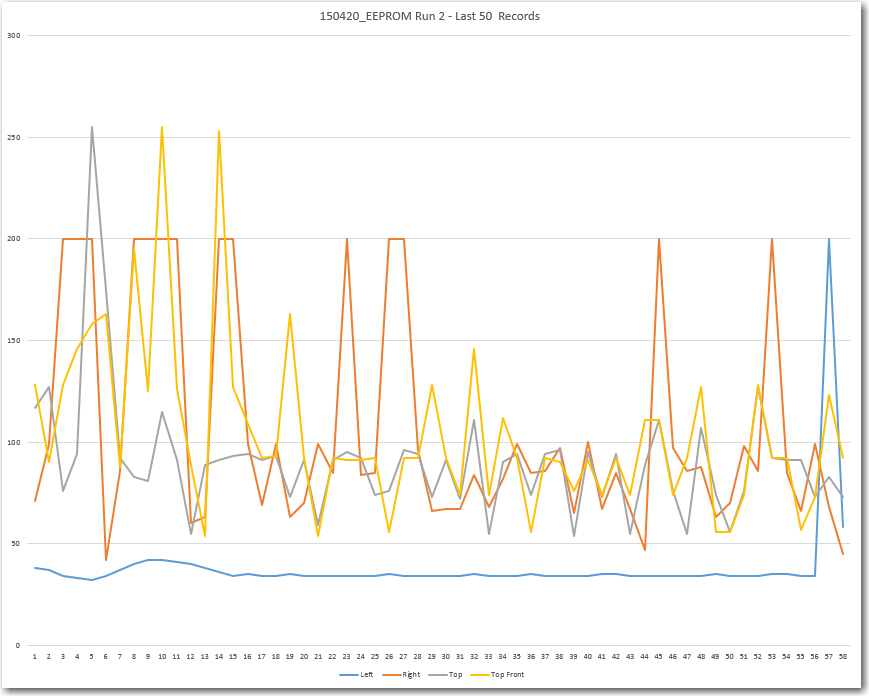
  • T + 37: Wall-E gets away!!  After 4 seconds, Wall-E manages to figure out that it is ‘stuck’ and backs away from the evil stealth slippers!  The sensor data in this 4-second period is extremely interesting, as this is the first time I’ve been able to see what Wall-E is ‘seeing’ when he gets stuck on the evil stealth slippers.  As previously assumed (but never confirmed until now!) the left sensor readings show very little variation, making the ‘stuck’ condition very easy to distinguish (at least from the human eyeball viewpoint), but the readings from the other three sensors aren’t so easy to interpret.  Contrary to expectations, and my ‘test range’ results,  both the front and top-front sensor readings show significant variations (as does the readings from the ‘off-side’ side sensor.  The problem is, I have no clue as to why Wall-E got away from the slippers.  The current code uses only the top and top front sensor readings to determine the stuck condition, and I can’t see anything in the last 50 records that would cause that determination to succeed.    There are two criteria for a ‘stuck’ declaration; if neither the front or top front sensors show significant variation for the last 50 points, or if the difference between the front and top front sensors exceeds more than half the max front sensing distance (255 cm for this run) at any time.  There are actually two points within the last 50 that satisfy the second of these criteria (the top front sensor reading goes to 255 but the front sensor reading stays at 120 and 80 respectively), but these don’t trigger a ‘stuck’ declaration – Wall-E stays glued to the slippers for another 2-3 seconds.  So, either I don’t understand what my own code is actually doing, or I don’t understand what is actually going into the 50-point deviation tracking arrays, or the EEPROM data isn’t what Wall-E is actually seeing, or some combination of all the above  (or something else entirely!).
  • Last 50 records before EEPROM recording ended.  Somewhere in  here is something that Wall-E used to declare the 'stuck' condition.

    Last 50 records before EEPROM recording ended. Somewhere in here is something that Wall-E used to declare the ‘stuck’ condition.

  • T + 39: EEPROM recording ends.

Well, I think I’m making some progress toward understanding Wall-E’s point of view (or maybe it’s his ‘point of hear’ instead?), especially with respect to how Wall-E manages obstacles like the evil stealth slippers.  I’m not there yet, although I am encouraged by how stable the left (near wall) sensor data looked while Wall-E was stuck on the slipper.  If that behavior can be confirmed by further observations, then it might be an easy and definite way of ‘stuck’ detection.

So, I have modified Wall-E’s code yet again as follows:

  • Moved the EEPROM initialization code until after the LED light startup sequence, thereby (hopefully) giving the compiler/load/bootloader code time enough to stop Wall-E’s main program before it wipes out the EEPROM data from the previous run.
  • Modified my ‘IsStuck()’ stuck detection function so that if it ever does detect a ‘stuck’ condition, it will
    • write the contents of the front and top-front 50-point history arrays to the the EEPROM (either after the newly collected sensor data if there is room, or by overwriting the initial set of sensor readings if there isn’t)
    • Light all 4 LEDs
    • Shut down the motors
    • Enter an infinite loop

By having Wall-E shut down and go to sleep, I can ensure that the ‘stuck’ detection is the very last thing Wall-E does, which should  mean that the captured array and sensor data is what Wall-E was using to make the detection.

Then I modified the EEPROM read-out program to print out the array contents in single columns  for ease of plotting, with a line in between the array contents and the remaining sensor readout values.


Stay tuned….

Frank
 

Gatlinburg, Tn NABC Regional, Postscript

April 18, 2015

I’m writing this from home on Saturday, after travelling back from Gatlinburg.  I got up this morning, had a last big breakfast at the Pancake Cabin, was on the road about 8:30 am, and was back here by 3:30 pm.  Got another 4-5 hours of prime book-listening  time on ‘Lucifer’s Hammer’, and home in plenty of time to catch up on email and write this post.  I also was treated to another ‘alternate reality’ experience as I left the Gatlinburg area.  When I came off the mountain road back into civilization, (if you can call that strip ‘civilized’), I saw mile after mile of antique cars lining the road on both sides of this big 4-lane highway, with people sitting in lawn chairs on the sidewalk as if they were watching a parade!  Evidently I had stumbled through  some sort of regular  antique car show/sales event.  I mean, they sometimes have something like this in the parking lot of our  local DQ restaurant, but this went on for miles!

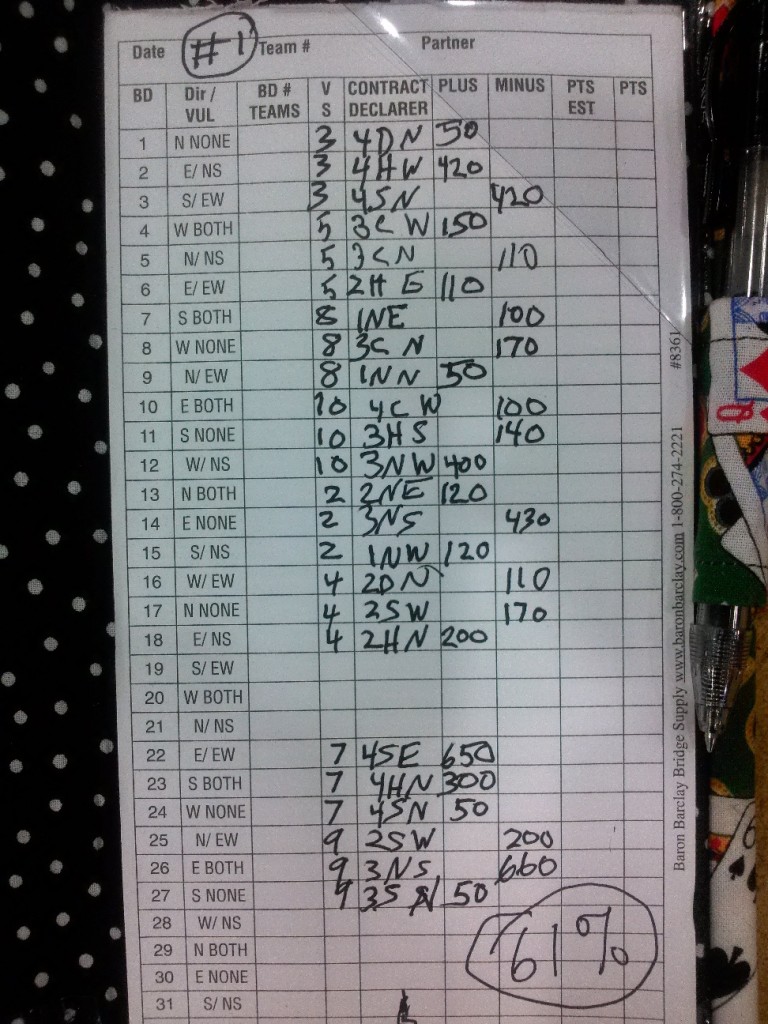
Just to round out my partnership desk experiences, my morning session partner never showed, so I was left with nothing to do until Mary and I played  the Friday afternoon and evening 299 pairs.  We did OK in the afternoon (52%, 0.46 MP red), but we really hit the jackpot in the evening pairs/team game, with a 61% for 3.81 MP red.  Mary was ecstatic (I was pretty happy too!), and it was a wonderful way to end my first Gatlinburg experience.

Mary and I managed a 61% game, taking 1st overall and 3.81 red

Mary and I managed a 61% game, taking 1st overall and 3.81 red

Gatlinburg Regional Mug/Pencil Holder

Gatlinburg Regional Mug/Pencil Holder

All in all, I had a wonderful time, got to meet and play with some tremendously nice folks, and even got a few points in the bargain (no gold though, drat!).  I’ll be back there next year, Lord willin’ and the creek don’t rise!

Frank


Adventures with Wall-E’s EEPROM, Part II

Posted 04/17/15

I haven’t had much time to work on the ‘stuck detection’ problem lately, as I have been playing duplicate bridge every day at the ACBL regional tournament here in Gatlinburg, Tennessee.  However, my pick-up partner for the morning session didn’t show, so I’m using the free time to think about the problem some more.

In my last post I showed that Wall-E gets confused in certain circumstances when what I believe to be multipath effects corrupt the data collected by the two front-facing ultrasonic sonar sensors.  My current ‘stuck detection’ algorithm relies on at least the top sensor getting good clean distance data, even if the lower one is completely or partially blocked (the ‘stealth slipper’ scenario).  When the data from  both sensors is corrupted, I’m screwed.  In my last post I showed some data I collected from a ‘stuck’ scenario using Wall-E’s on-board EEPROM, and this data made it crystal clear that both sensors were getting bad data.  So, what to do?  Time to go back to the drawing board and devise a new, improved ‘stuck detection’ algorithm that takes in to account the new information.

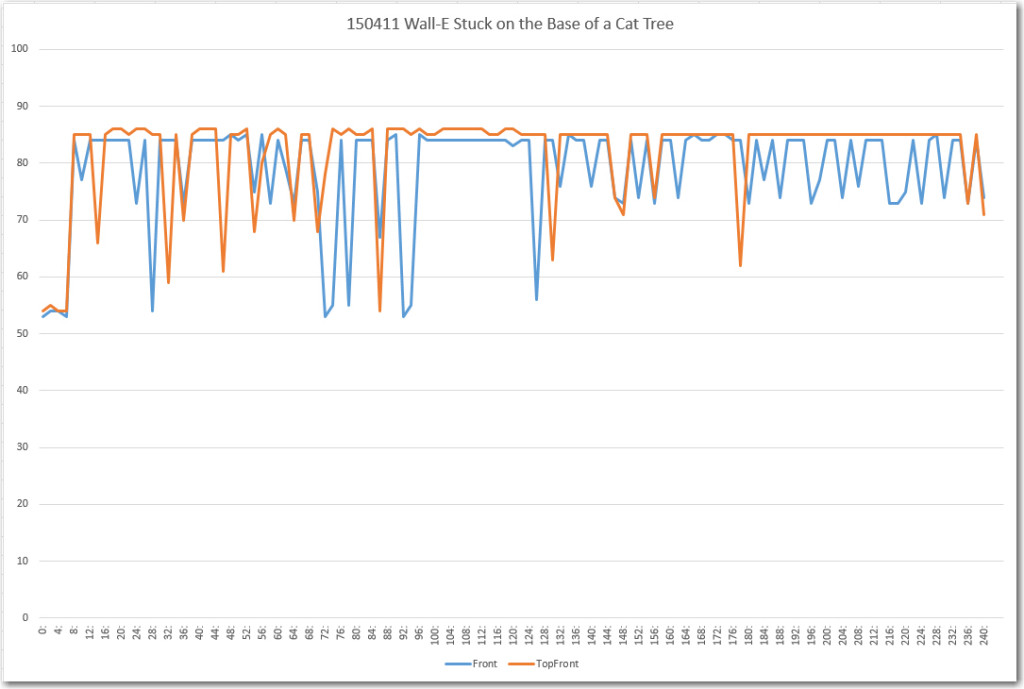
Excel plot of the front and top-front sensor data while Wall-E was stuck on the base of a cat tree

Excel plot of the front and top-front sensor data while Wall-E was stuck on the base of a cat tree

Here’s what we have:

  • The ‘stealth slipper’ scenario, where the lower sensor is partially or completely blocked, while the upper one is not.  In this case, the upper sensor may report a real distance if there is an obstacle  within the set MAX_DISTANCE_CM parameter, or it may report zero if there isn’t .  The lower sensor can sometimes also report zero when it is blocked by the fuzzy slippers, as the slippers absorb or deflect enough of  the ultrasonic energy to make the sensor think there’s nothing there.  The ‘stuck’ detection algorithm handles this case in a two-step process.  First, if both sensors report very little variation  over time (meaning the distance to the next obstacle isn’t changing) then a ‘stuck’ condition is declared.  Or, if the deviation over time of the bottom sensor is different than the variation  over time of the top sensor (the bottom sensor is partially blocked by the slipper, and reports widely varying distance readings), then a ‘stuck’ condition is declared.  A potential flaw in this algorithm is that either or both sensors can report a constant zero even if Wall-E is moving normally, but there simply isn’t anything within the set  MAX_DISTANCE_CM parameter.  In the current algorithm, this is addressed by setting the  MAX_DISTANCE_CM parameter to 400 cm for the front sensors, on the theory that in a normal wall-following scenario, there is always something within 4 meters (13 feet or so).
  • The  normal wall-following scenario, where (hopefully) the front sensors report a steadily declining distance, with enough variation over time to avoid triggering a ‘stuck’ detection.  In this mode, the side sensor reporting the smaller distance will be  used for primary left/right guidance.
  • The multipath scenario, where the physical geometry is such that the front sensors report widely varying distances, sometimes the same, and sometimes different.   The present ‘stuck detection’ algorithm fails completely here, as the top sensor reports enough variation over time  to pass the first test, and there isn’t enough variation difference between the top and bottom sensors to satisfy the second one.  I don’t think there is anything to be done about the problem with the first test, as the presence of variation over time is the  only  reliable indicator of movement.  However it seems to me that the second test (differential variation between the two sensors) can be improved.  The differential variation test essentially compares the average variation in the top sensor to the average variation in the bottom one, and this clearly doesn’t work for the multipath case.  But, if I compared the two sensor readings on a point-by-point basis over a few seconds, I should be able to detect the mutipath case.  Maybe a running count of differences that exceed a set threshold (from the plot, it looks like a 10 cm distance threshold would work)?  Then if the count/sec exceeds some other threshold, declare a ‘stuck’ condition?

Anyway, I’m starting to think there may be some hope for Wall-E after all; maybe he won’t wind up stuck forever under a cat tree somewhere.  In any case, I think it would be wise to use my new-found EEPROM powers to collect some more ‘real-world’ data before I leap too far to a conclusion.  I think I might even want to include the side sensors in the reporting, so I can see what is actually happening during a typical wall-following sequence, as well as when Wall-E is actually stuck.  I think I can probably get at least 10-20 seconds of data without running out of EEPROM space, so we’ll see.

Stay tuned,

Frank


Gatlinburg, Tn NABC Regional, Part II

Posted 04/17/15

I’m writing this from my hotel room Friday morning, killing time before the afternoon pairs sessions start at 1pm.  This is my last day here at the Gatlinburg tournament, and I must say I’ve gotten my money’s worth (not in points, unfortunately, but in fun and experience).  I was told that this was a great regional to play in, and I certainly agree with that assessment now.  The organization was superb, the facilities great, and the people uniformly pleasant and helpful; doesn’t get any better than that (well, I could have played a lot better, but that’s not their fault;-) ).

Hugh, Judy, Dee and I played in a Knockout (KO) game Monday afternoon, as we had been told this was the best route to gold points.  In the KO format, teams of 4 compete against other teams in a 12-board Swiss Team game, and the losing team is ‘knocked out’ of the competition.  If you win a couple of rounds of this, you are pretty much assured of getting some gold points.   However, the downside is if you lose, you are out of the game entirely.  Well, we basically got our rear ends kicked, so our hopes for gold points were dashed   pretty soundly.  Being the persistent sorts, Hugh and I tried again the next day with a pickup team, and this time we got through one round before being KO’d, and we even tried a 3rd KO game the next day with another pickup pair, and again got KO’d on the first round.  This was pretty disappointing, as we thought we were bringing a pretty decent game to the party.  In retrospect it looks more like we brought knives to a gunfight! ;-).

After that, Hugh and I decided we would try our luck at the partnership desk, and I got hooked up with a ‘young’ (30 pts) player from Marrietta Ga, named Mary.  She and I were able to put together a 40% for the first session  of a two session ‘Gold Rush’ pairs game, and a 57% for the second one. We got some red points for the 57% game, but because we hadn’t done well in the first session, we missed out on the gold. :-(.  We did, however, have a lot of fun, so that was it’s own sort of ‘gold’.  The next day (Thursday), Mary and I played in another Gold Rush 2-session game, but were unable to get out of the 40’s for either session.  After that, Mary suggested we try the stratified 2-session game for Friday, thinking that the non Gold Rush fever types might be a little bit easier for her, and I agreed.

So, Mary and I will play these last two sessions today, and then I’ll be on my way back home again tomorrow morning, in my red Ford F-150 with ‘Lucifer’s Hammer’ on the CD player again.  I won’t be taking any gold back with me, but I will be taking memories of some really great bridge played with some really great people, in a very interesting setting.  Lord willin’ and the creek don’t rise, I’ll be back here again next year! ;-).

Frank
 

Gatlinburg, Tn NABC Regional, Part I

Posted 04/12/15

I’m writing this from my room in the Le Conte View Motor Lodge, right across the street from the Gatlinburg Convention Center, site of the 2015 Gatlilnburg NABC Regional Tournament.  I’m down here with Hugh, Trish, Judy and Dee from the Columbus Bridge Center, hunting for gold “in them there hills” ;-).

I didn’t really know what to expect when I started this adventure – I just wanted to come down here and play some bridge, maybe earn a few points and experience a regional tournament.  I drove myself in my trusty Ford F-150 pickup (not your normal bridge vehicle, that’s for sure!).  I put the hotel address into my Tom Tom GPS, and ‘Lucifer’s Hammer’ by David NIven into my CD player, and hit the road, expecting to arrive in some sleepy town in southeastern Tennessee.  What I  did not expect was the abrupt transition from suburban Knoxville to some sort of combination of alternate-reality,  fun-house carnival, beach resort, and mountain hideaway!  I first realized something strange was going on when  I started passing Hollywood-themed establishments packed side-by-side with each other; King Kong clinging to a skyscraper on this side, the Titanic complete with water rushing by its bow on the other, and a 3-story upside-down courthouse, complete with upside-down lawn and trees!  Then there was another abrupt transition from all the fun-house madness to an idyllic mountain road (albeit a modern 4-lane one) by an idyllic mountain stream, with no human habitations in sight.  This continued  up into the Smoky Mountains right into the city limits of Gatlinburg.  In fact, I had begun to wonder whether I had missed a turn or something, when, with no warning at all, I was deposited back into the fun-house/beach resort alternate reality.  Ripley’s Museum, a quickie marriage chapel, a ‘Space Needle’ (how did I get from Tennessee to Washington state?), and everything else a person might dream of (in a nightmare about being lost on the boardwalk of a beach resort).  People everywhere, walking along the one main street.  Cars everywhere, driving at 5mph.  Long lines of motorcycles, also driving 5 mph, most with two riders.  Pickup trucks filled with hillbillies with the confederate flag prominently displayed.  Buildings crammed together check-by-jowl as if every square inch of real estate was more precious than gold (and I suspect it is!).  I found my hotel without any problem, because it, like every other hotel/motel in Gatlinburg, fronts on the one main street.  As I pulled into the hotel parking lot, I noticed that the hotel buildings (there are three, I think) are all oriented perpendicular to the street, reinforcing the impression that street frontage is hugely expensive.

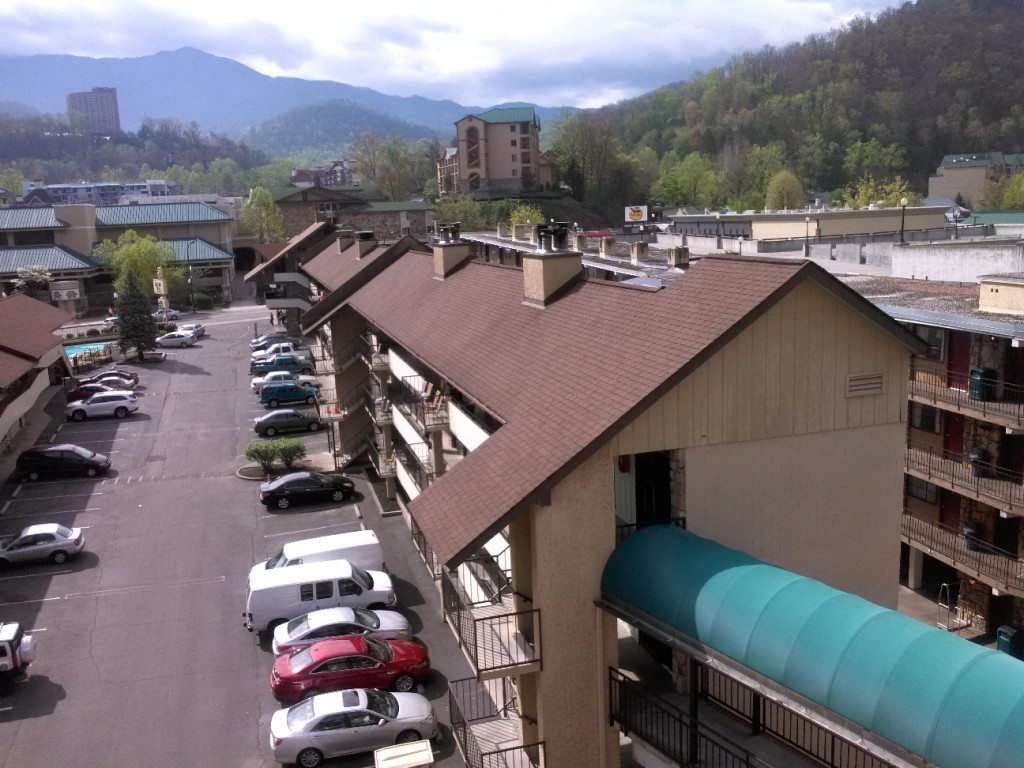
Rooftops looking southeast from my hotel room

Rooftops looking southeast from my hotel room

Looking east from my room.  The convention center can be seen in the background, just across the street from the hotel

Looking east from my room. The convention center can be seen in the background, just across the street from the hotel

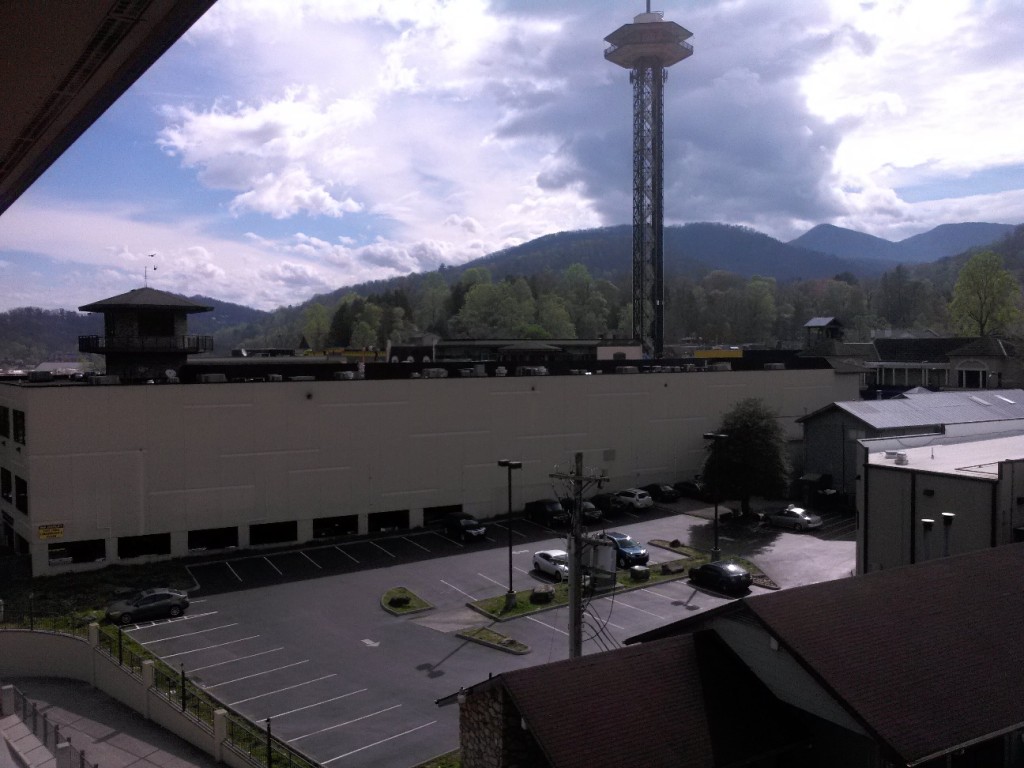
Looking northeast from my hotel room, the Gatlinburg 'Space Needle'

Looking northeast from my hotel room, the Gatlinburg ‘Space Needle’

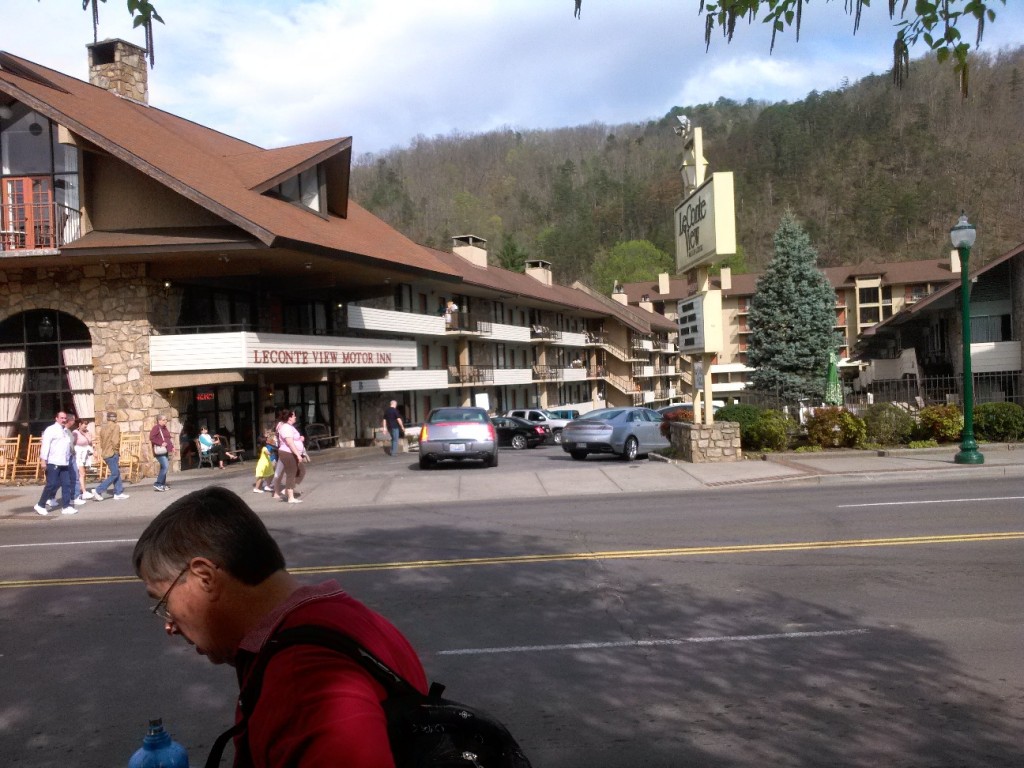
Le Conte View Motor Lodge, seen from the steps of the convention center

Le Conte View Motor Lodge, seen from the convention center

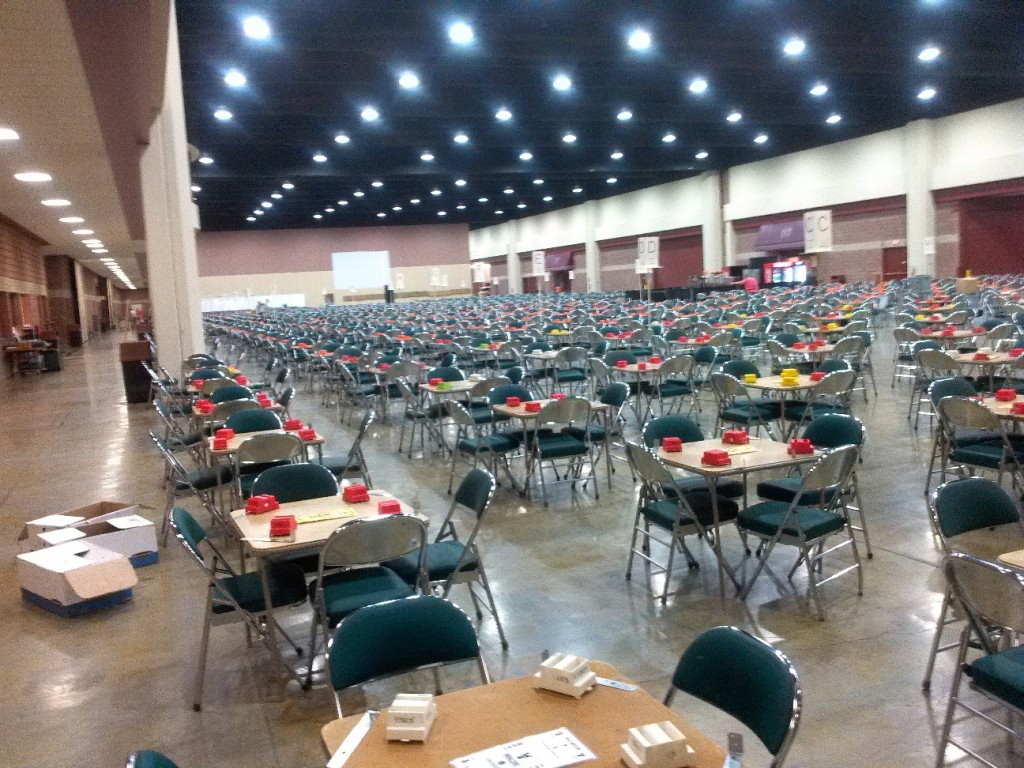
I got checked into my room and decided to walk around a bit and get myself oriented for tomorrows tournament start.  I found the convention center OK (right across the street, hard to miss), and wandered around inside a bit.  I peeked into the main playing area on the first floor, and was in for another shock.  The main room is at least 100 yards long and at lest 50 yards wide, completely full from edge to edge with bridge tables.  Down the middle of this huge room was a line of bridge tables with a single chair sitting on top of the table; For a while I thought this was maybe a setup mistake, but there were too many of them for that.  Then I realized there was one such table for every column of tables – they must be game section boundaries of some sort.  Later, after taking the phtograph below, I realized that it showed  only one half of the main playing area – there’s another entire section beyond the far wall!

The main playing hall.  There is another complete playing area behind the far room divider

The main playing hall. There is another complete playing area behind the far room divider

After this I walked from the convention center to what I think was the southern  edge of town – maybe 1/2 mile – no more.  And each foot of the way was crowded hotels, restaurants, the fore-mentioned quickie marriage chapel, a real church right next to it, tatoo parlors, tee-shirt/gift shops, and everything else imaginable.  The other way from the hotel was the same – every imaginable themed entertainment/fun ride establishment, plus  lots of themed restaurants (Bubba Gump Shrimp Co, for one), plus a few ‘normal’ franchises like Dunkin Donuts, Five Guys Hamburgers, and TGI Friday thrown in for good measure.

All this incredible variety of tourist-oriented businesses crammed into such a tight area stoked my curiosity, so I spent some time reviewing the town’s history on Wikipedia.  Turns out it’s location at the entrance to the Smokey Mountain National Park made it a natural tourist stop. From Wikipedia: in 1912, the town consisted of about 6 houses, a Baptist church, and a blacksmith’s shop.  In 1934 (the first year the park was opened), 40,000 tourists visited the town, with that number swelling exponentially to 500,000 within a year!  In 1992 an entire city block burned to the ground and was subsequently rebuilt (that explains the strange new/old character of the place, I guess).  Now the place is all hotels, motels, restaurants, and arcade-style game places of all descriptions,  but no houses  at all (or at least I never found any).

All for now – its late and I want to get some sleep before the opening day tomorrow.

Frank


Adventures with Wall-E’s EEPROM

Posted 4/12/15

At the conclusion of my last post (New ‘stuck’ Detection Scheme, Part VI), I had decided that I needed to investigate the use of the EEPROM on board Wall-E’s Arduino Uno as a potential way of recording actual field data, in an effort to find out what is really happening when Wall-E gets stuck and can’t get un-stuck.

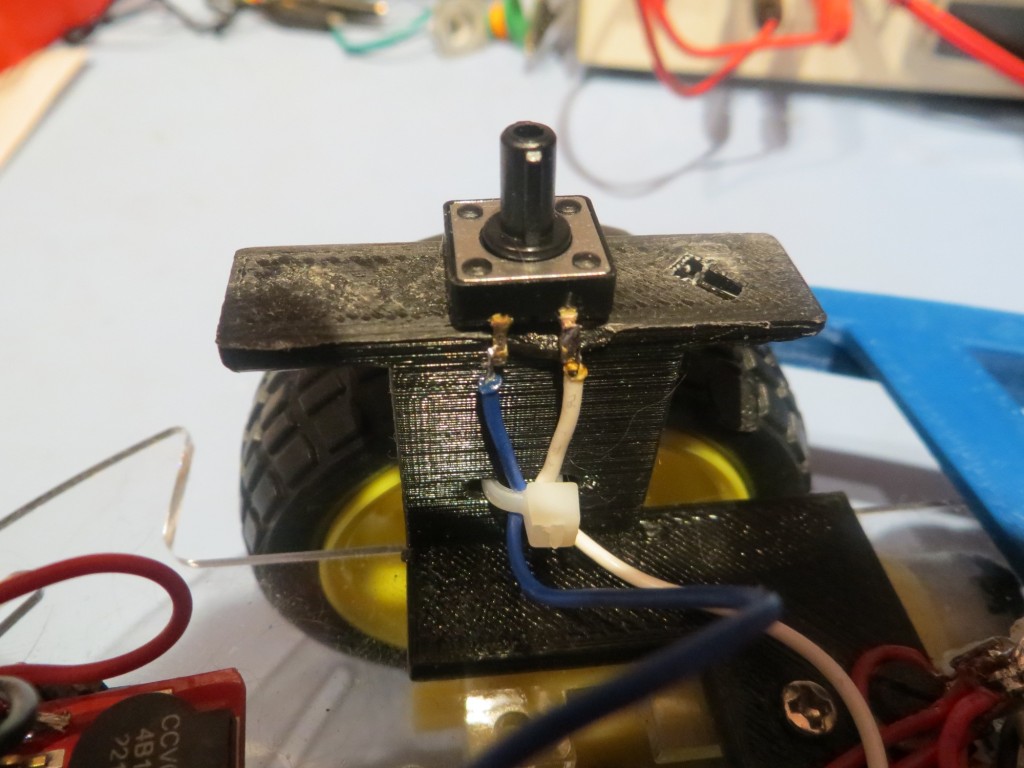
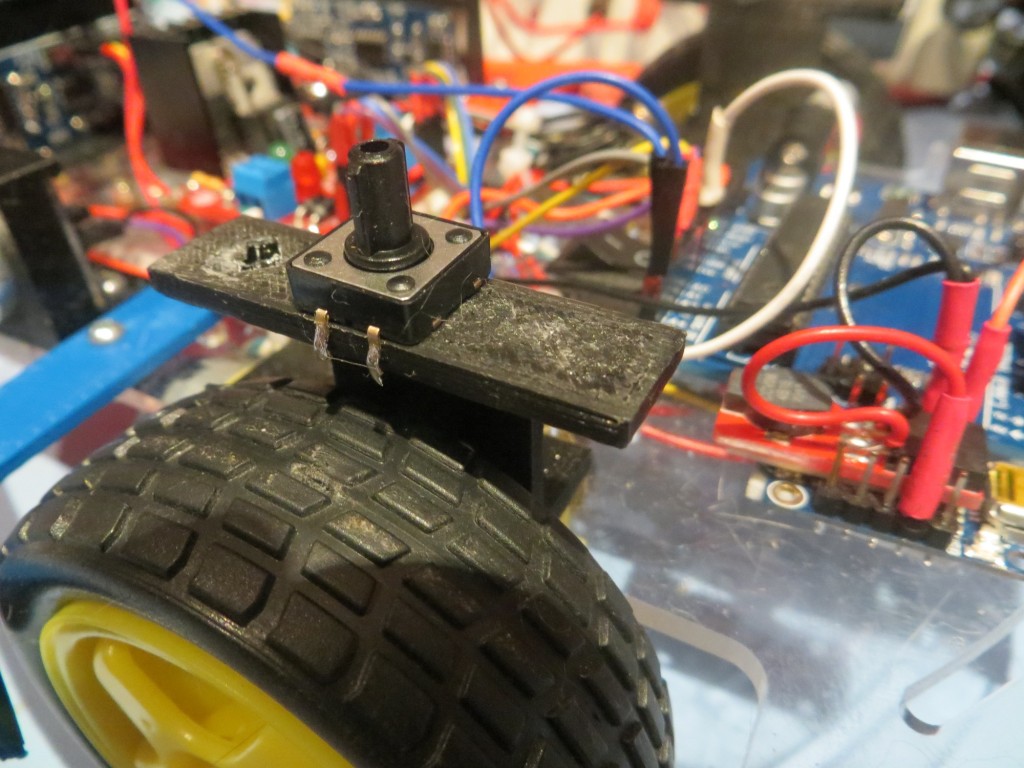
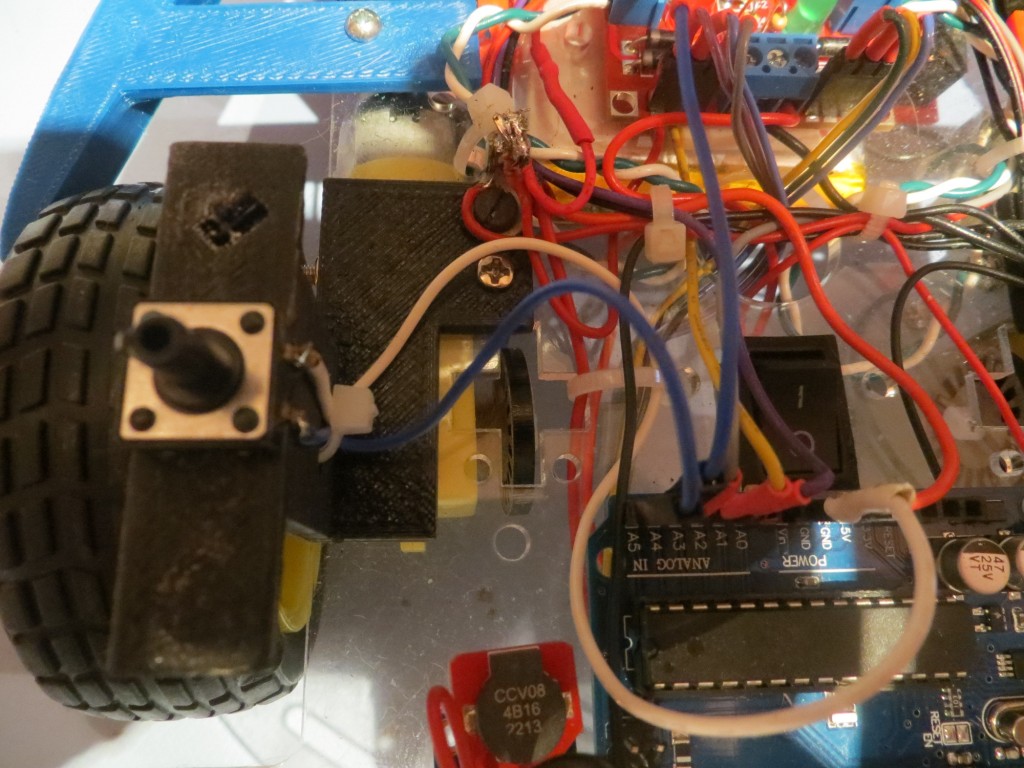
OK, so the plan is to add a pushbutton to Wall-E’s hardware to trigger sensor data collection into EEPROM.  Then I can read the data out later using another program.  I happened to have a fairly decent selection of pushbuttons from other projects, so this part wasn’t a problem.  I decided to use an unused analog port (A5), with it’s pullup resistor enabled, so all the pushbutton has to do is pull that line to ground.  Then I could modify Wall-E’s code to write sensor data to EEPROM for as long as the A5 line is LOW.

The following photos show the pushbutton hardware and wiring

Side view showing pushbutton wiring and strain relief

Side view showing pushbutton wiring and strain relief

Side view showing pushbutton location on left wheel cover

Side view showing pushbutton location on left wheel cover

Top view showing pushbutton connections to the Arduino Uno

Top view showing pushbutton connections to the Arduino Uno

Next, I modified Wall-E’s code to write the current front and top-front sensor measurements to EEPROM in an interleaved fashion whenever the A5 line was LOW.

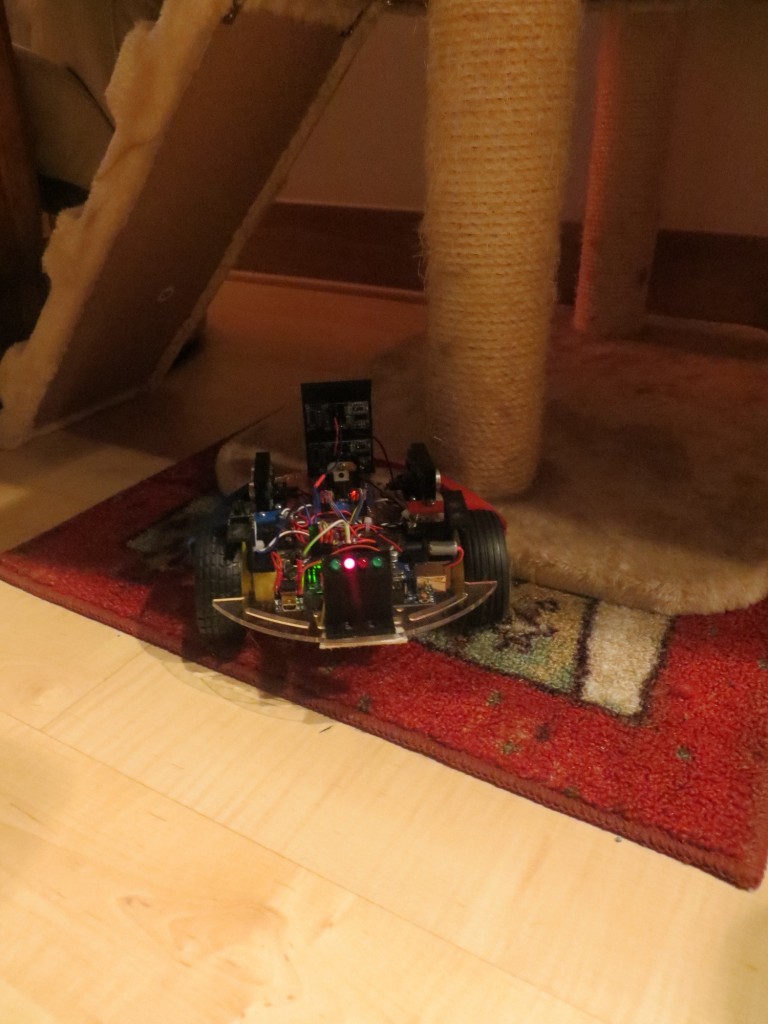
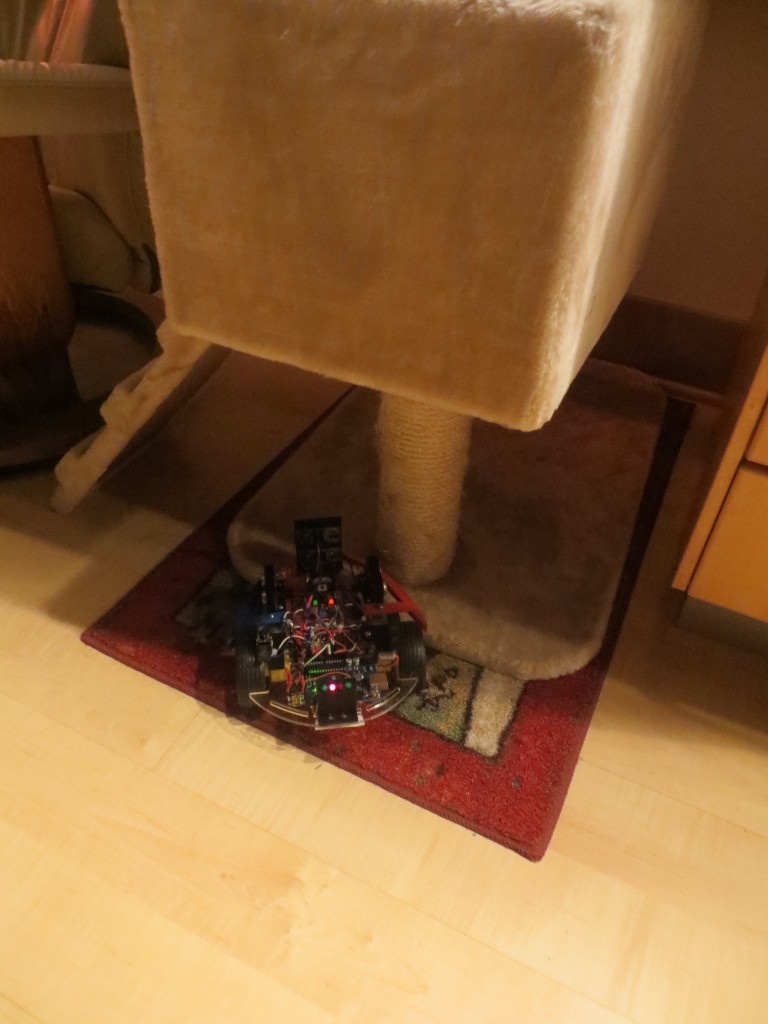
Next I wrote another small sketch to read the EEPROM values back out and de-interleave them into two columns of sensor measurements so it would be convenient to use Excel to plot results.  After testing this on the bench, it was time to let Wall-E loose on the world to ‘go get stuck’.  As if Wall-E could sense there was something wrong, it did its best to  not  get stuck.  I had almost run out of patience when Wall-E ran into the base of one of our cat trees and stuck – grinding its wheels but not going anywhere.  I was able to collect several seconds of data from the two front sensors – YES!!

Wall-E stuck on the base of a cat tree

Wall-E stuck on the base of a cat tree

Wall-E stuck on the base of a cat tree

Wall-E stuck on the base of a cat tree

After loading the readout program, extracting the sensor data and sucking it into Excel, the following plot shows what I collected.

Excel plot of the front and top-front sensor data while Wall-E was stuck on the base of a cat tree

Excel plot of the front and top-front sensor data while Wall-E was stuck on the base of a cat tree

This was  not what I was expecting to see!  I had expected to see stable data, indicating that I had screwed up the algorithm somehow, and fixing the algorithm would fix the ‘stuck’ detection problem.   Instead, the above plot clearly shows that it is  the data that is screwed up,  not the algorithm!

Looking more closely at the data, it appears that the stable sections around 85 cm are probably representative of the actual distance from Wall-E’s front sensors to the wall behind the cat tree.  However, the only explanation I can come up with for the large variations in both sensor readings is some sort of multipath effect, caused by parts of the scene that aren’t directly ahead, but  are in the view of the ping sensors.  I have some experience with multipath effects from my time as a radar/antenna research scientist at The Ohio State University, and it is a very hard  problem to deal with.  Eliminating or suppressing multipath effects is basically impossible with single sensors, or even multiple co-located ones; in order to address multipath, a space-diversity scheme for sensors is required, where sensors are spaced far enough apart so that if a particular multipath path creates  constructive interference at one sensor, it will create destructive interference at the other.  Then the data from both sensors can be averaged to achieve a better, more stable result.  This is  infeasible to do for Wall-E, but maybe, just maybe, that isn’t totally necessary.  Maybe I can look for the pattern of variation between the two front sensors shown above. Currently I’m looking for large differences in the  total deviation  between the front and top-front sensors, but this is essentially an averaging process.  Maybe it would work to compare the two sensors on a measurement by measurement basis?

Stay Tuned…

Frank
 

New ‘stuck’ Detection Scheme, Part VI

Posted 04/10/15

After an exhaustive (and exhausting!) set of ‘indoor range’ tests that (I thought) gave me a very good understanding of the ‘stuck’ detection issue, I made the changes I thought were necessary and sent Wall-E back out into the real world – where he promptly got stuck and  didn’t  recover! He got stuck climbing up onto the lip of a rug – and sat there merrily grinding away for what seemed like forever (but was only for a minute or so) before I took mercy on it.

Clearly the situation ‘in the field’ isn’t quite as simple as my ‘indoor range’ configuration, but the differences are  not obvious.  In an effort to figure this out without running around in circles, I’m trying to change just one thing at a time, as follows:

  • Changed the ‘STUCK_DIST_DEVIATION_THRESHOLD’ from 5 cm to 10 cm.  This helped a little, and didn’t seem to increase the frequency of false positives significantly.
  • Changed the  MAX_DISTANCE_CM from 200 cm to 100 cm, on the theory that in the ‘real world’ there is more clutter beyond 100 cm that can cause significant measurement deviation.  This change caused Wall-E to declare a ‘stuck’ condition almost continually – and I have no idea how  THAT happened!
  • Changed the  MAX_DISTANCE_CM back to 200 to verify that Wall-E’s behavior changed back to what it was before the change.  Check.
  • Changed the  MAX_DISTANCE_CM back to 100 and removed the guard code around the call to  UpdateWallFollowMotorSpeeds() in  MoveAheadTilStuck().  Changing the MAX_DISTANCE_CM back to 100 caused the false ‘stuck’ declarations to resume, and removing the guard code had no effect one way or the other.

So, what’s the deal with changing the MAX_DISTANCE_CM parameter?  It is only used in two places in the code – in the NewPing() constructor for all four sensors, and in the line ‘frontdistval = (frontdistval > 0) ? frontdistval : MAX_DISTANCE_CM + 1; in  MoveAheadTilStuck().  This line converts a zero reading from the front sensor to  MAX_DISTANCE_CM + 1 (101 in this case).  Since I’m no longer using the front sensor reading for the ‘stuck’ determination, I have no clue why this line (or lack of it, for that matter) would make any difference.

The only other potential clue in this whole mess is the way the sensor reading arrays are being handled.  The idea was that when a ‘stuck’ detection occurred, The arrays should be re-initialized in such a way that another ‘stuck’ detection could not occur until after another ARRAY_SIZE measurements have been collected.  The way I chose to do that was to simply place a large positive reading followed by a zero in the top of each of the 4 arrays, guaranteeing (I thought!) that those two adjacent values would prevent a ‘stuck’ detection for at least ARRAY_SIZE measurement cycles.  In order to verify that this ‘poison pill’ feature is actually working, I added the ‘PrintDistInfo()’ function from my PingTest project to Wall-E4 and ran it in debug mode on my bench.   Using this technique, I was able to watch (albeit slowly) the ‘poison pill’ values roll through my distance sensor value arrays.  So, it appears that is working fine, and the ‘stuck’ detection algorithm is working perfectly, too – in that it detects the ‘stuck’ condition as soon as it is able too (all the real distance information is pretty static with Wall-E sitting on the bench with no power to the motors)

So, the only conclusion i can reach with this information is that the MAX_DISTANCE_CM reduction from 200 to 100 significantly reduced measurement deviation, to the point where Wall-E was declaring ‘stuck’  even when he wasn’t.  This tracks with another observation – Wall-E seemed to declare ‘stuck’ just as the distance from one  or the other side sensors increased, like an open door or something like that.  Apparently this causes a ‘out of bounds’ (zero) return with a MAX_DISTANCE_CM of 100 more often than with 200.

So, what to do?  I can just use the differential distance readings between the front and top-front sensors, but while this should work for the slipper case where the front sensor is partially or totally obstructed, it won’t work for the coat rack or rug edge case where both front sensors are unobstructed.  It might  work to use a two dimensional test; if the two front sensors have close to the same readings but those readings don’t vary over time,  OR their readings differ significantly at any time, then declare ‘stuck’.  If I go this way, I’ll need to open up the front sensor max distance to something more than 200 cm (300-500?) so Wall-E won’t declare ‘stuck’ in an open hallway.  Since the side sensors would no longer be used for the determination, I could keep their max distances short – say 100 cm, which would allow me to shorten the post-ping delays for them a bit.

  • Change  MAX_DISTANCE_CM to 400 cm.  Use  MAX_DISTANCE_CM for the two front sensors and  MAX_DISTANCE_CM / 4  for the side sensors.
  • Change the ‘stuck’ detection algorithm to use only the front sensors, as discussed above
  • Remove  the  aRightDist and aLeftDist arrays.
  • Change the inter-ping delays.  It is generally a good idea to wait 20-25 msec between ping sensor triggers to avoid returns from one sensor being interpreted as returns by another sensor.  However, I believe it is OK  to have  no delay between the left and right ping sensors.  In order for ping energy from the left sensor to be interpreted as a return by the right sensor, that energy has to arrive at the right sensor  after the right sensor has been triggered, and  before the right sensor’s energy gets back.  If the delay from left to right sensor activation is more than about 25 msec, there’s no way the first criteria (arriving after the right sensor is triggered) can be met, so this is perfectly safe, if a bit wasteful of time.  However, if they are triggered together (no inter sensor delay), then there is no way the second criteria can be satisfied for any reasonable geometry, as the left sensor’s energy will always have farther to travel by 2 times the distance from the left sensor to the nearest object.  So, I believe it is safe to trigger the left and right sensors together, then delay 15-25 msec between the L/R pair and either the top-front or front, and then another 15-25 msec between the two  front sensors.

OK, so I made the changes described above, and Wall-E is  still  getting stuck, although less frequently than before.  In fact, there were a couple of times during the last set of field trials where it seemed that Wall-E was actually doing very well.  However:

  • The wall following performance is still mediocre at best, especially compared to where it was before I started adding inter ping sensor delays.
  • Wall-E still gets stuck and won’t declare ‘stuck’ for no apparent reason.  In one case he had his nose pressed firmly up against a solid surface, which should have produced stable readings from both front sensors, but apparently satisfied neither the max deviation nor top-front/front deviation difference criteria.   In another, both front sensors were unobstructed, and the nearest obstacle was only about 75 cm away – should have been a slam-dunk, but wasn’t.

At this point, I think the only way forward is to find a way to record what is actually happening with Wall-E during a period where it the ‘stuck’ criteria should be met, but nothing is happening.  My hope is that I can figure out how to use Arduino’s EEPROM to record data ‘on the fly’.

Stay tuned!

Frank
 

New ‘stuck’ Detection Scheme, Part V – Stealth Slipper Study

Posted 04/08/15

As I drifted off to sleep last night, it occurred to me that I had not really completed my study of ping sensor responses, as I did not yet fully understand what was happening with the ‘stealth slipper’ (aka the wife’s fuzzy slippers) case.  So, this morning I re-opened the Paynter indoor test range for some additional tests.  As shown below, I placed a slipper in various orientations in front of Wall-E’s dual front ping sensor setup, and took sensor data for each case.

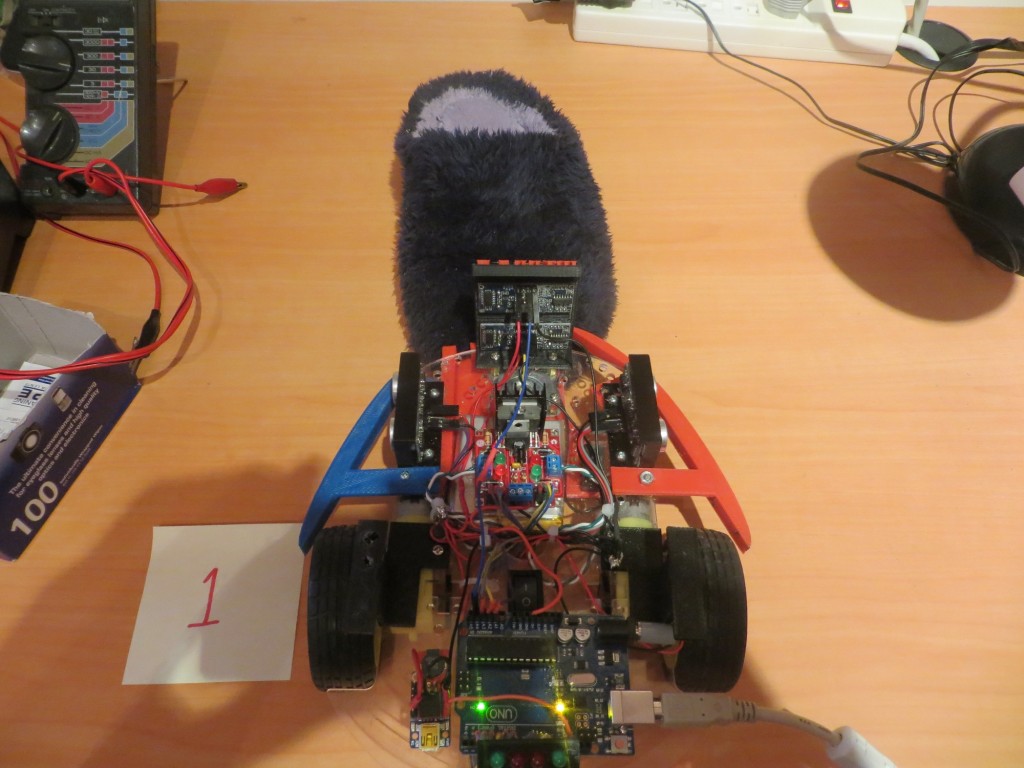
Test 1: Slipper Head-on:

Slipper head-on with robot front

Slipper head-on with robot front

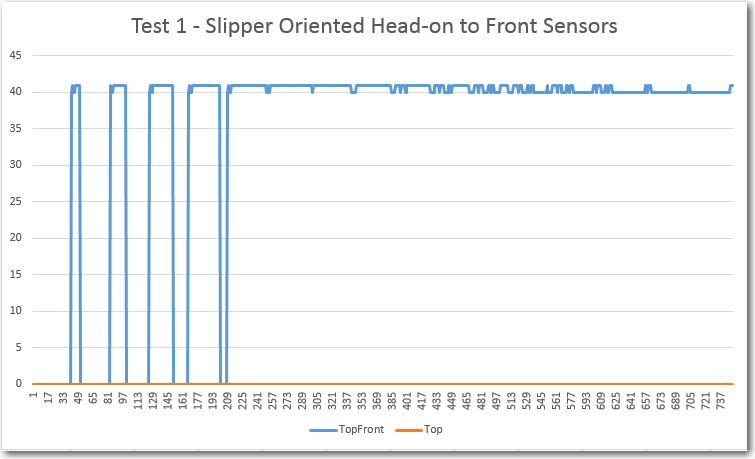
Test 1 results.  Note front sensor ping being completely absorbed, causing it to return zeroes

Test 1 results. Note front sensor ping being completely absorbed, causing it to return zeroes

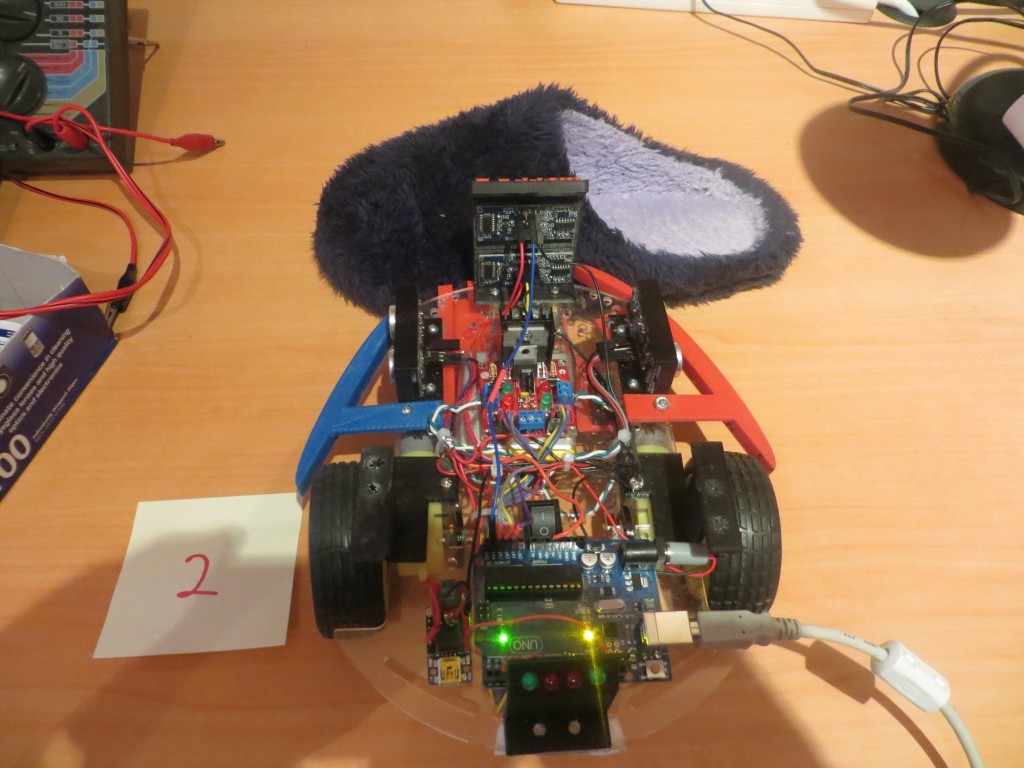
Test 2: Slipper Rotated 90 Degrees CW:

Slipper turned 90 degrees  clockwise

Slipper turned 90 degrees clockwise

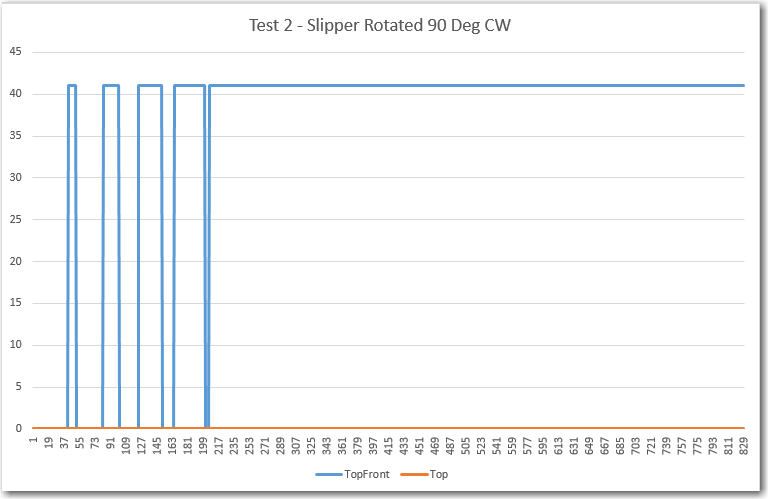
Slipper rotated 90 degrees CW.  Note lower ping sensor still completely blocked, but upper one is still OK

Slipper rotated 90 degrees CW. Note lower ping sensor still completely blocked, but upper one is still OK

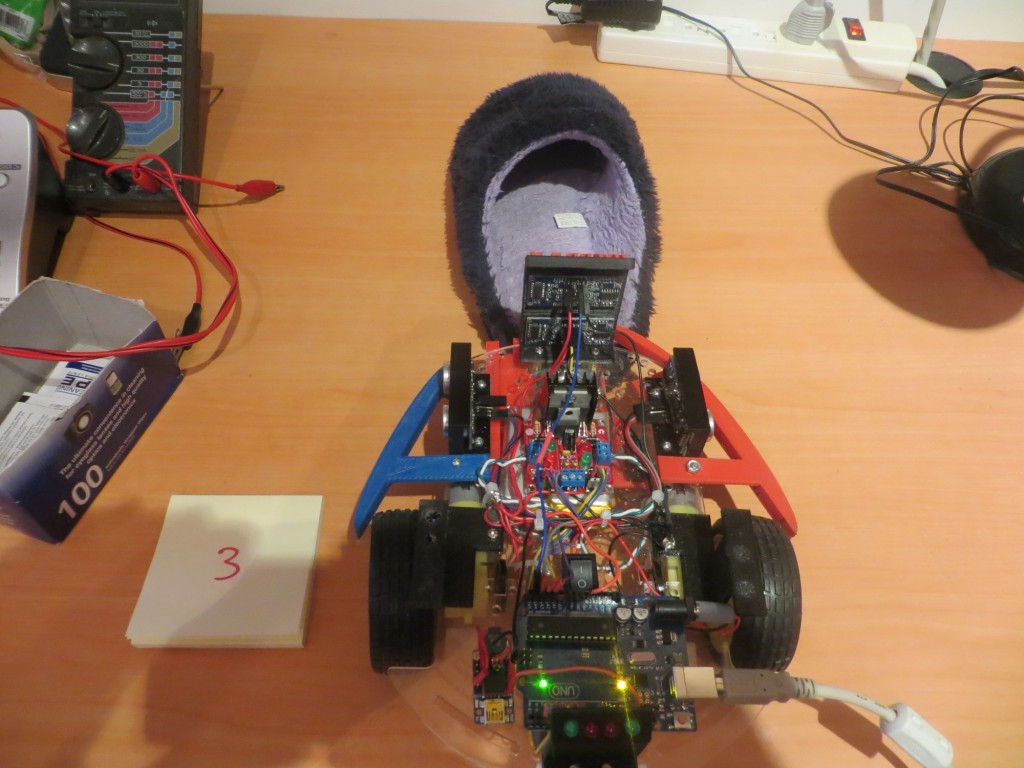
Test 3: Slipper Rotated 180 Degrees CW:

Slipper turned 180 degrees clockwise

Slipper turned 180 degrees clockwise

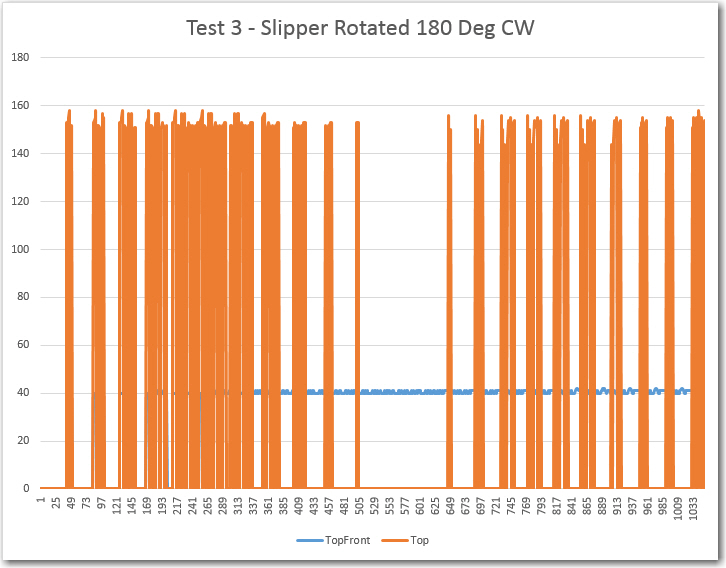
150408_SlipperTest3Plot

This result is pretty interesting in that it looks like the front sensor gets confused by the open cavity presented by the slipper in this configuration, while the top-front sensor is nice and stable.  This is a very good justification for having both forward-looking sensors!

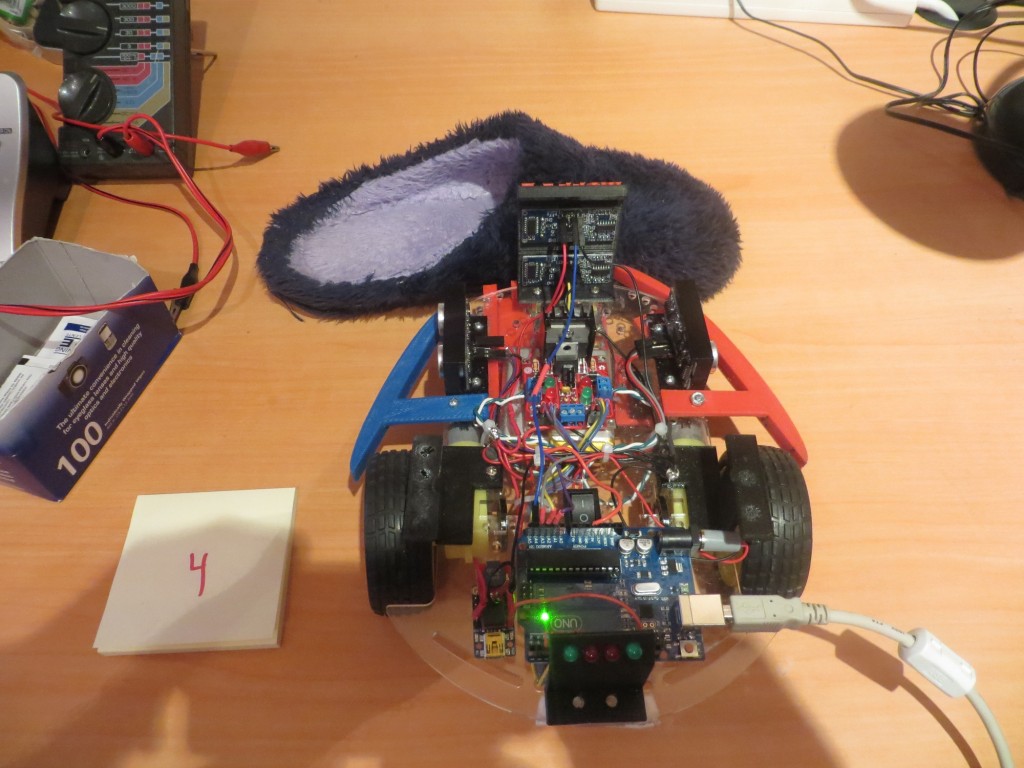
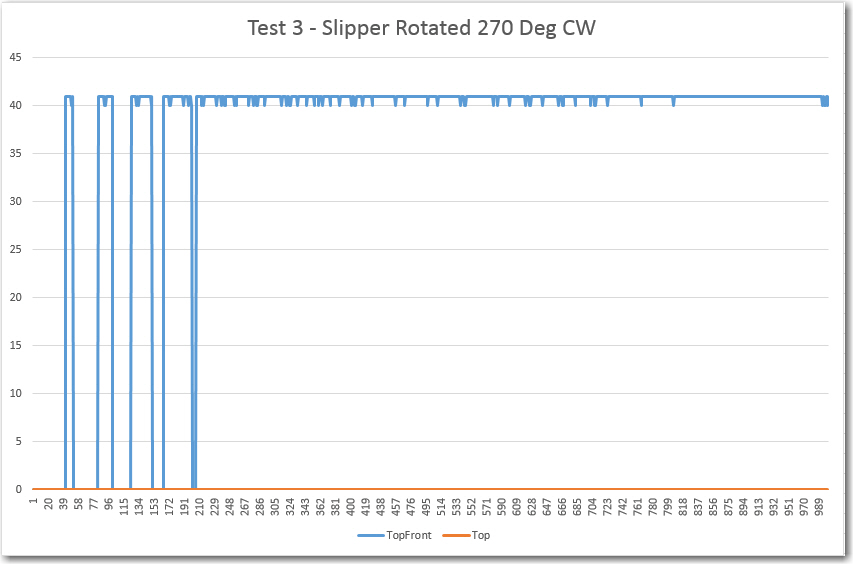
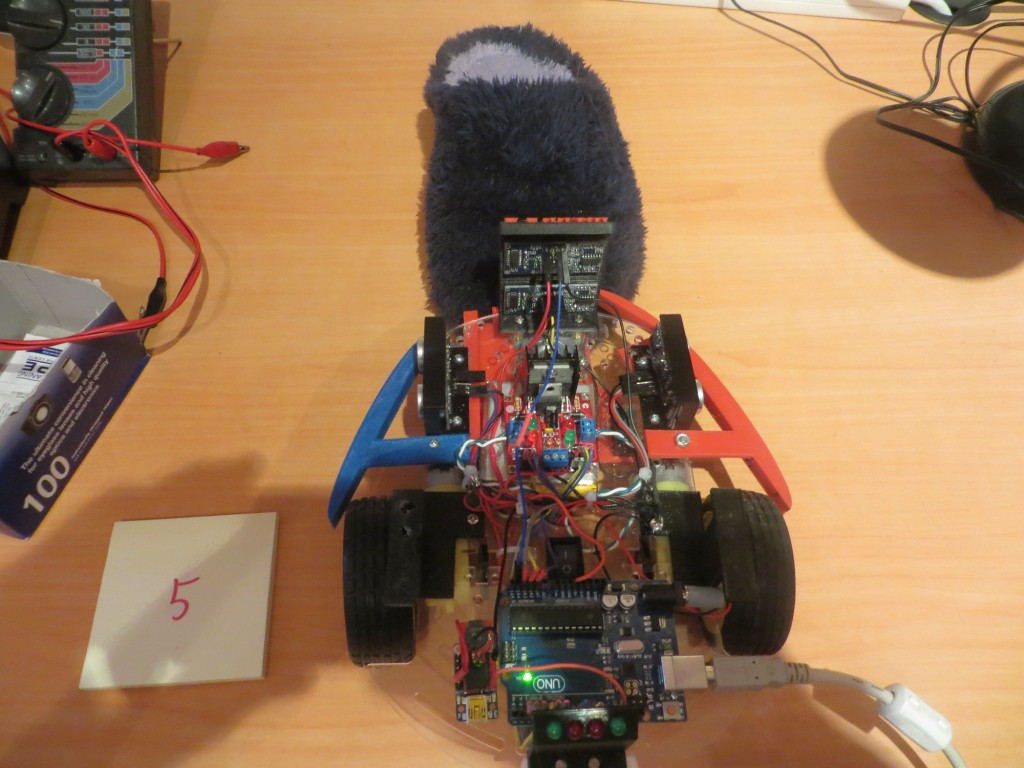
Test 4: Slipper Rotated 270 Degrees CW:


Slipper turned 270 degrees clockwise

Slipper turned 270 degrees clockwise

150408_SlipperTest4Plot

The plot shows that the lower (front) sensor is completely blocked,  (returning zeros), while the upper (top-front) sensor is completely clear, returning a nice, stable reading with a max deviation of just 1 cm.  Again, this plot is a great justification for having two forward-looking sensors.

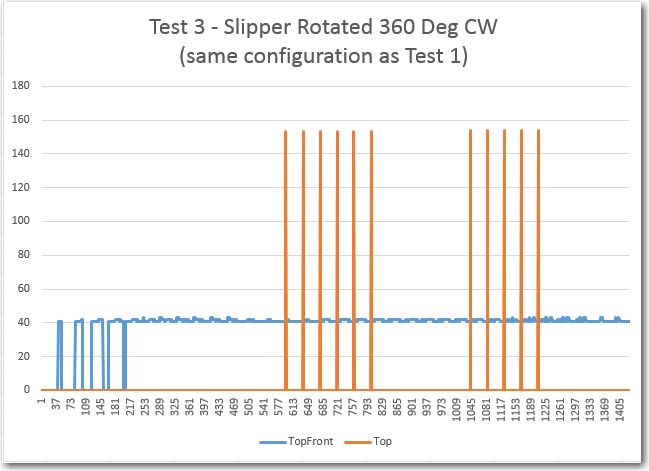
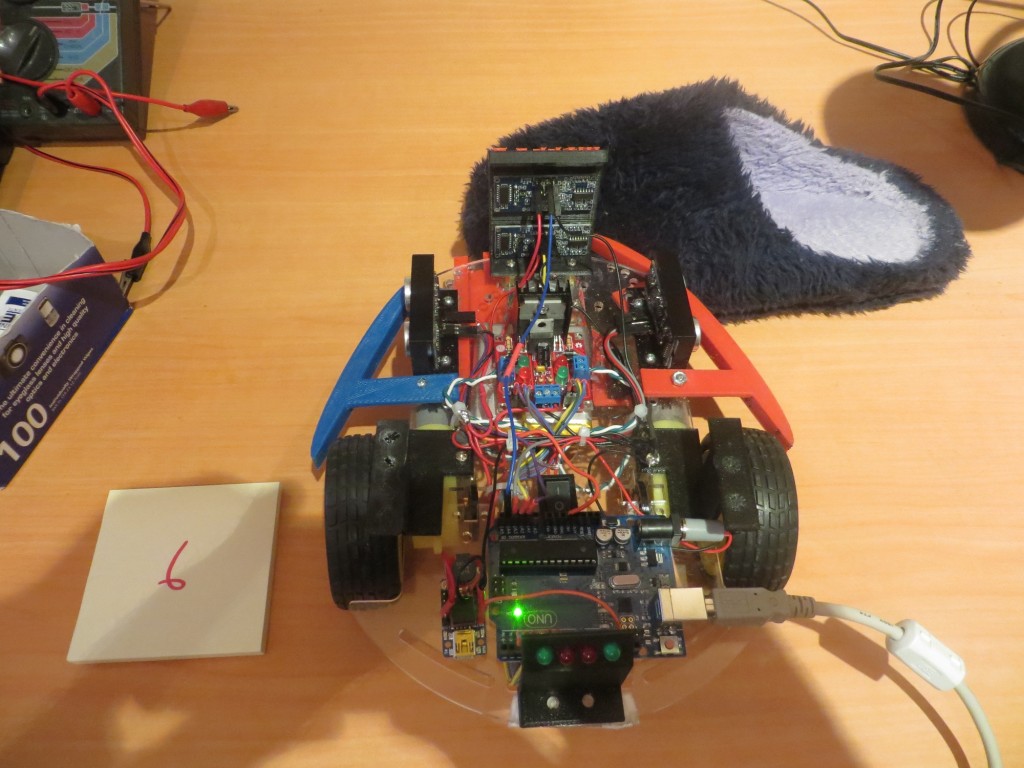
Test 5: Slipper Rotated 360 Degrees CW:

Slipper rotated 360 degrees clockwise (same configuration as Test 1)

Slipper rotated 360 degrees clockwise (same configuration as Test 1)

150408_SlipperTest5Plot


This is the same configuration as Test 1, but with different results :-(.   I suspect the difference is due to the slipper being offset laterally one way or another, just enough to cause the spikes noted.  Another possibility is that there is occasionally just enough echo from the fuzzy slipper to make the sensor think there is something there, but at extreme range.  In any case, the top-forward sensor continues to provide a nice, stable response with minimum deviation.


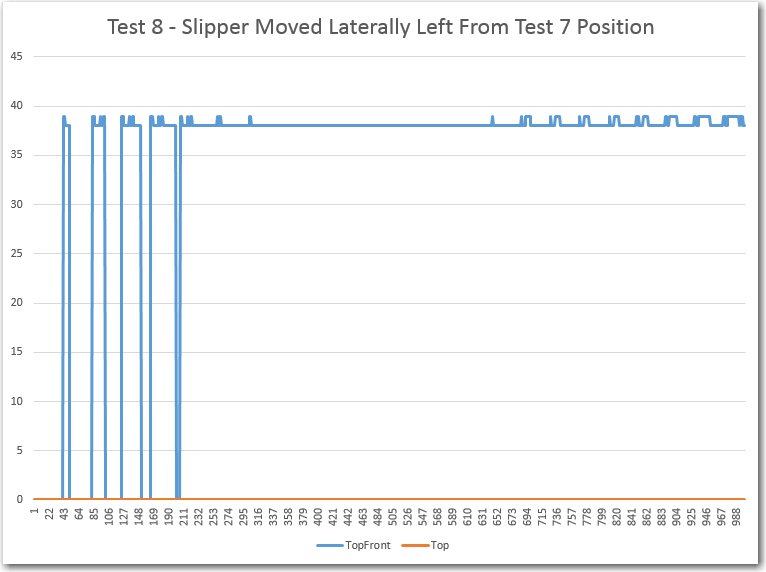
Test 6 – 10  : Slipper Rotated 90  Degrees CW and Translated from Far Right to Far Left:

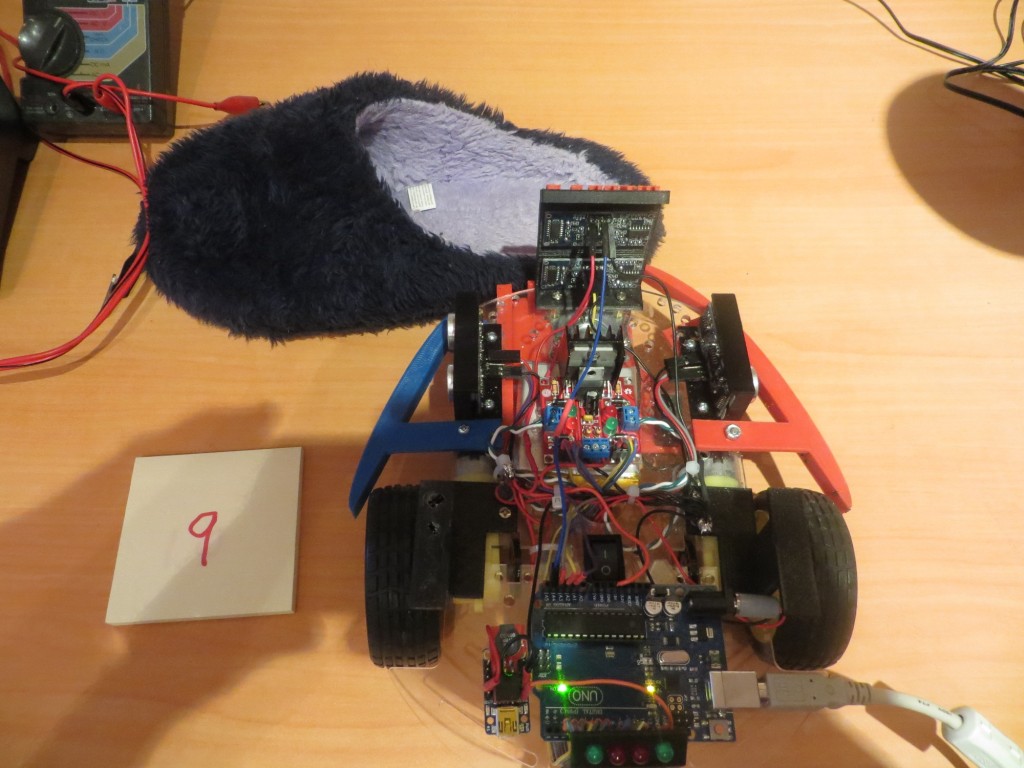
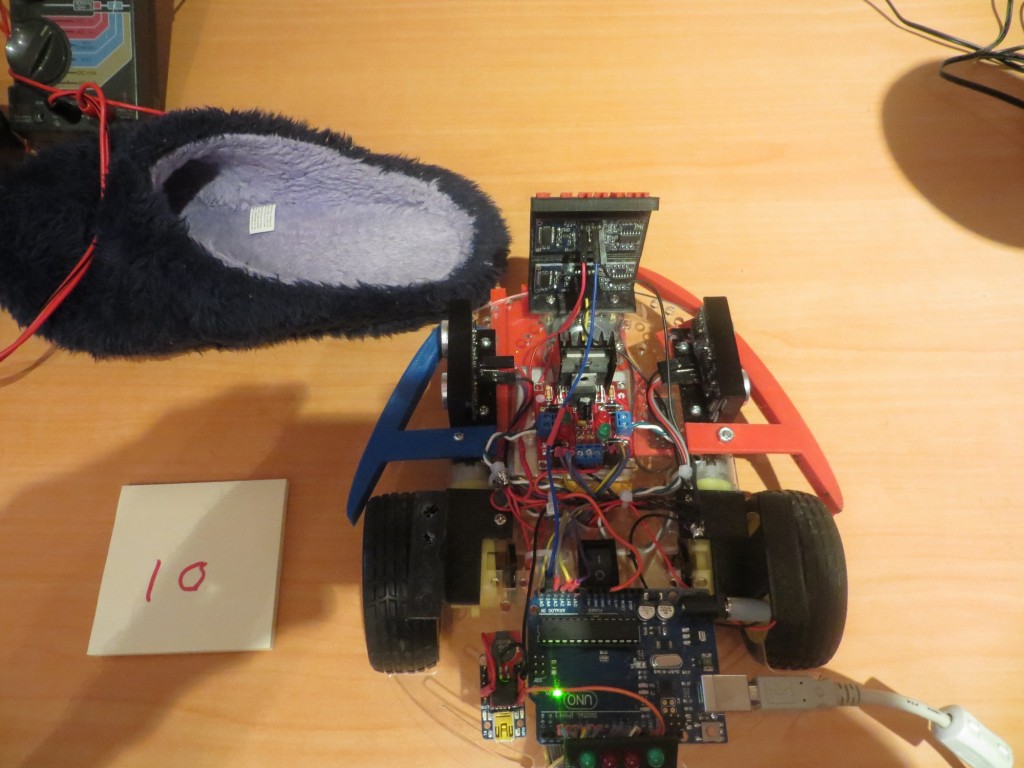
This series of configurations starts with the slipper in the 90 degree CW rotation position (similar to Test 2) but translated to the right. Then it is moved through three intermediate positions (Tests 7-9) to a position out of view to the left (Test 10).

First of 5 tests with the slipper moving laterally from right to left

First of 5 tests with the slipper moving laterally from right to left

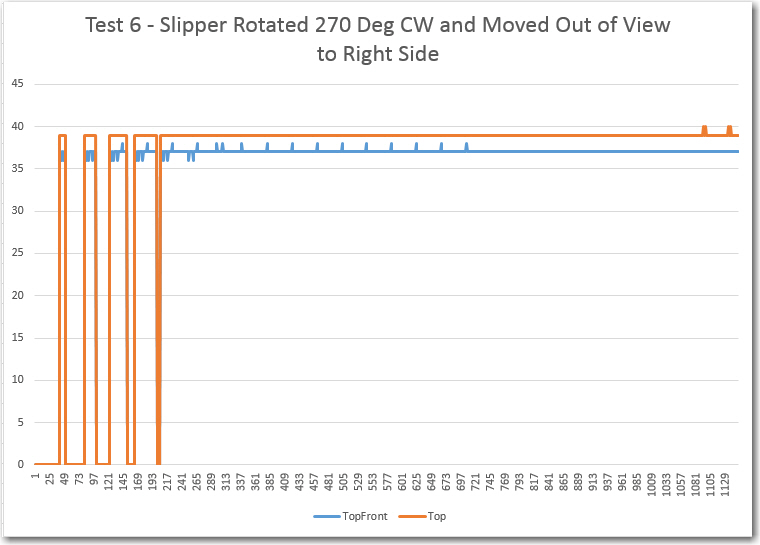
150408_SlipperTest6Plot

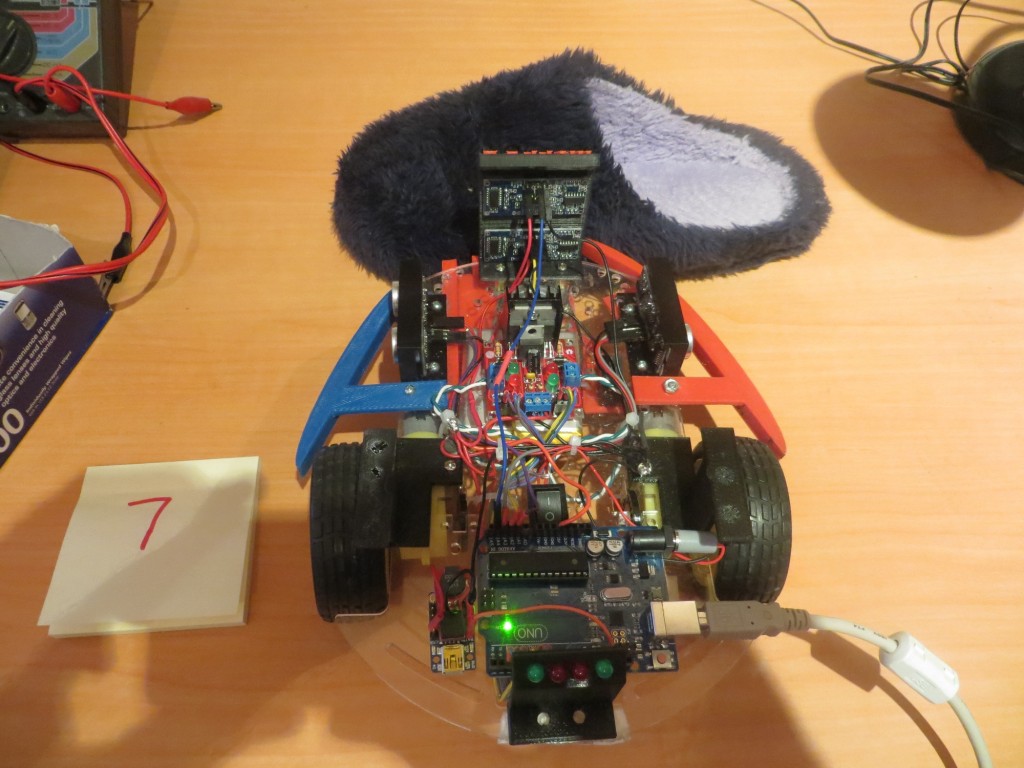
Second of 5 lateral displacement tests, with the slipper moving from right to left

Second of 5 lateral displacement tests, with the slipper moving from right to left

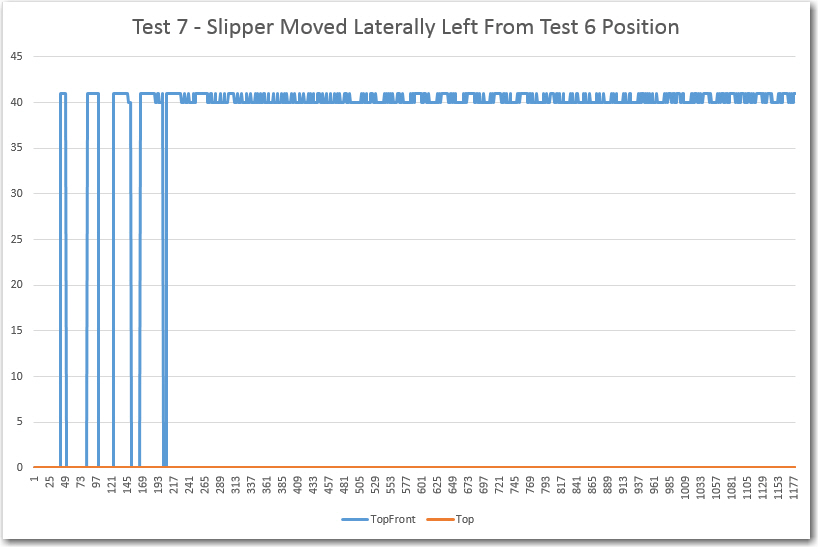
150408_SlipperTest7Plot


The Test 6 position is apparently far enough to the right so that both the front and top-front sensors have a (mostly) clear view to the front, producing stable returns with a maximum deviation of just 1 cm for both.


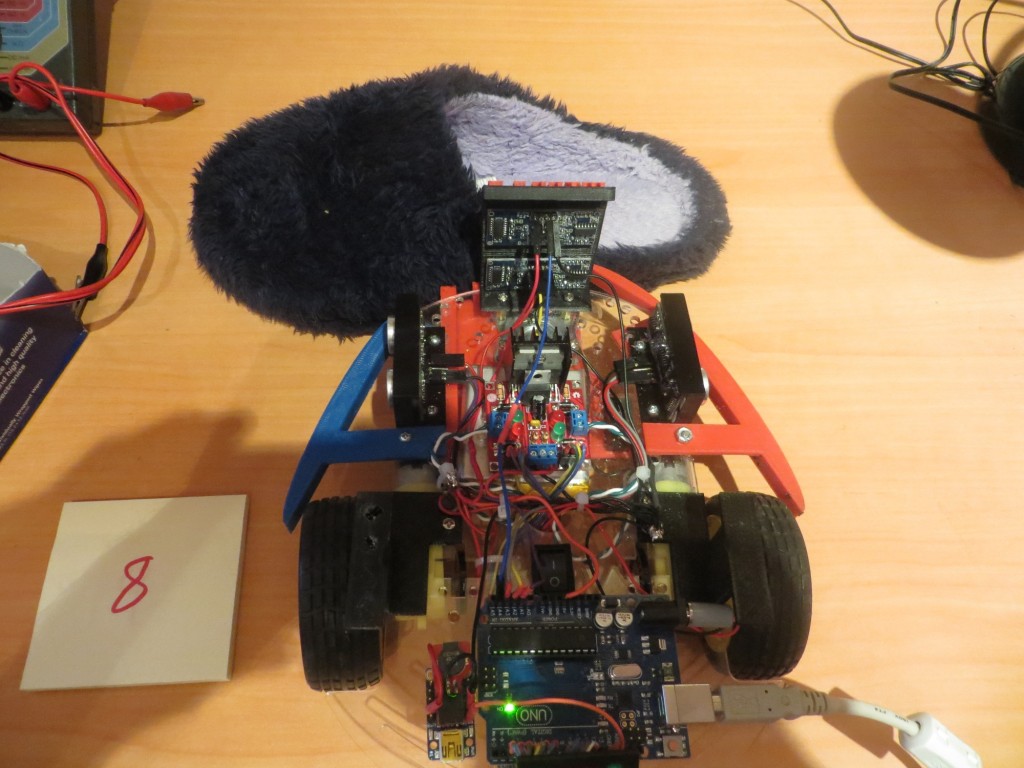
Third of 5 lateral displacement tests, with the slipper moving from right to left

Third of 5 lateral displacement tests, with the slipper moving from right to left

150408_SlipperTest8Plot


Tests 7 and 8 show the same result – the front sensor is blocked (returning zeros) and the top-front sensor can still see, returning a stable result with a maximum deviation of 1 cm.


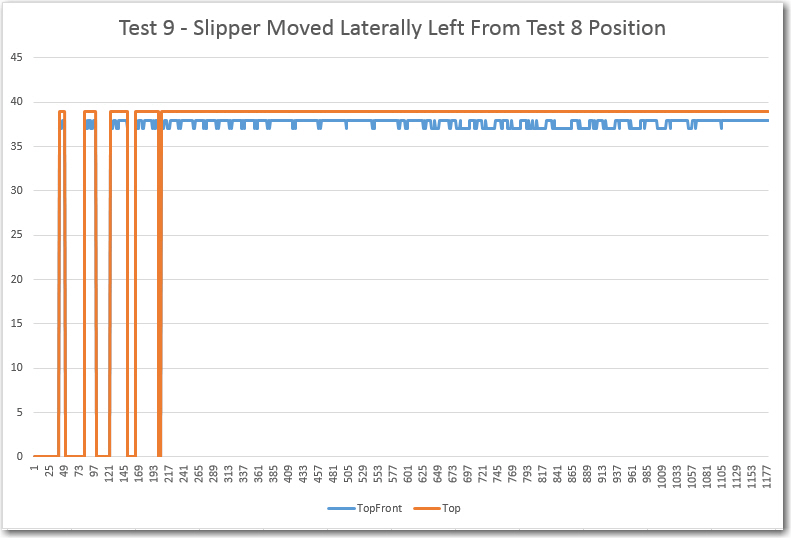
Fourth of 5 lateral displacement tests, with the slipper moving from right to left

Fourth of 5 lateral displacement tests, with the slipper moving from right to left

150408_SlipperTest9Plot

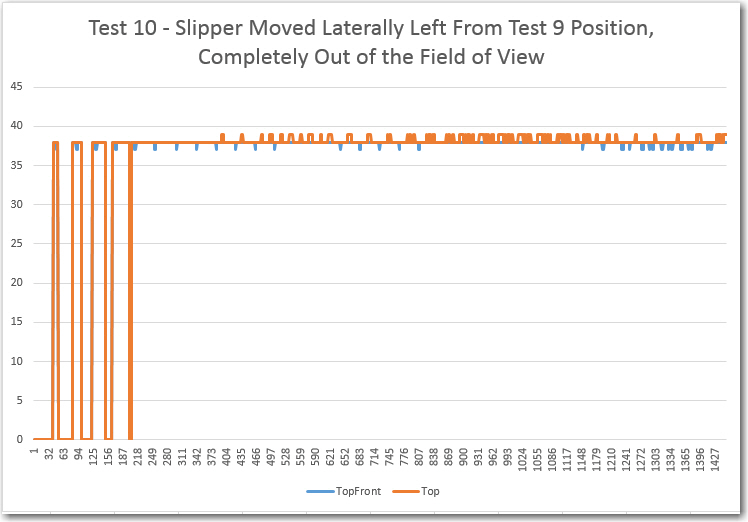
Last of 5 lateral displacement tests, with the slipper moving from right to left.  In this test, the slipper is all the way out of the field of view

Last of 5 lateral displacement tests, with the slipper moving from right to left. In this test, the slipper is all the way out of the field of view

Test 10 results.  Note both front and top-front sensors return nearly identical, stable results.

Test 10 results. Note both front and top-front sensors return nearly identical, stable results.

Tests 9 and 10 are also similar, clearly showing that both the front and top-front sensors can see the wall at around 37/38 cm, with a maximum deviation for both sensors of 1 cm.


Summary and Conclusions:

This post describes a set of measurements intended to explore the effect of my wife’s ‘stealth slippers’ on Wall-E’s forward sensor performance, in order to implement an effective algorithm for getting Wall-E ‘un-stuck’ when it runs up against a slipper during its travels through the house.  Ten separate tests were performed in a controlled environment, recording both the front and top-front sensor responses to various slipper configurations.

Based on the test results above, I think I can safely make the following conclusions:

  • The top-forward sensor can reliably ‘see over’ a slipper and reliably produces a stable response (the actual distance if there is an obstacle, or zero if there is nothing within 200 cm), with a maximum variation of 1-2 cm.
  • When  both sensors report similar distances, then it is almost certain there is no nearby blocking obstacle (aka ‘stealth slipper’).
  • When the top-front and top-front sensors report wildly different numbers, then it is highly probable that Wall-E has gotten stuck on a slipper (or other low-lying obstacle) and the ‘stuck’ algorithm should be triggered.
  • The SR-04 sensors and the NewPing driver library seem remarkably accurate and stable. All the problems experienced so far with ‘unreliable readings’ have been self-inflicted, mostly by not heeding the time separation requirements.

Frank
 

New ‘stuck’ Detection Scheme, Part IV

Posted 04/07/15

In my last post, I described the results from ping sensor testing in my ‘indoor acoustic testing range’, AKA ‘my office’. The results were plotted in a series of Excel charts. While these results did vividly illustrate why Wall-E was having so much trouble detecting the ‘stuck’ condition, they also raised a number of questions. In the previous post I listed a number of follow-on tests I thought I should perform, as follows:

  • Do the same experiment with the front ping sensors disabled, to eliminate the possibility of echo contamination between the front and left and/or right sensors.
  • Look at the front ping sensor response when Wall-E’s nose is pressed up against a wall.  This won’t normally be an issue, as Wall-E’s normal obstacle avoidance routine will make it stop and turn around when it gets within about 10 cm of an obstacle, but I have disabled that while trying to work out the ‘stuck’ detection issues. So, I need to understand just what is happening in this case.
  • Change the MAX_DISTANCE_CM parameter from 200 to 100.  It is clear to me from my lab ‘indoor test range’ experiments that 100 cm in each direction is more than enough to handle almost all situations in my house, and if this change eliminates the wild variations with no object in view, so much the better.

Do the same experiment with the front ping sensors disabled, to eliminate the possibility of echo contamination between the front and left and/or right sensors.

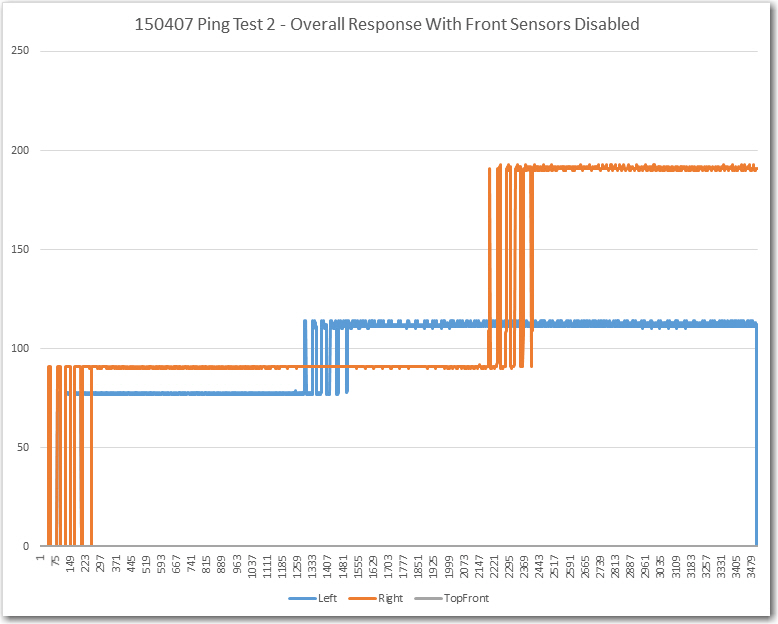
In this experiment I simply disconnected  the front and top-front ping sensors from the Arduino, and ran the same experiment as before.  I started with all 3 obstacles in place, removed the left obstacle after a few seconds, and then removed the right one (didn’t need to do anything with the front one).  This produced the following plot

Ping test with front ping sensors disconnected.  Note that both the left and right sensor data are 'clean' except for the obstacle/no obstacle transition period

Ping test with front ping sensors disconnected. Note that both the left and right sensor data are ‘clean’ except for the obstacle/no obstacle transition period

Note that both the left and right ping sensor data are very clean except during the brief period when the obstacle is being removed.  This result clearly shows that there is some external feedback happening between the front ping sensor and at least the left sensor.  I  thought I had been careful about spacing the sensor ping intervals in time to avoid just this possibility, but clearly I wasn’t as careful as I thought!.  Shortening the MAX_DISTANCE_CM parameter to 100 vs 200 might eliminate (or at least suppress) that problem, but I would really prefer to definitely prevent it entirely.  Looking at the code, I see the following commands for ping spacing in my ‘MoveUntilStuck()’ loop:

leftdistval = LeftPing.ping_cm();
delay(25); //added 04/04/15
rightdistval = RightPing.ping_cm();
delay(25); //added 04/04/15
frontdistval = FrontPing.ping_cm();
delay(25); //added 04/04/15
topfrontdistval = TopFrontPing.ping_cm(); //added 04/04/15

The ‘delay(25)’ should be more than adequate to prevent one set of pings from leaking into another sensor, but (now that I’m looking for it), I see that I didn’t put a ‘delay(25)’ after the TopFrontPing.ping_cm() call.  If the subsequent processing were fast enough (and I think it is), then the time between this call and the LeftPing.ping_cm() call could be very short – like just a few milliseconds.  This  could be the cause of the large variations  noted in the left sensor data after that obstacle was removed.  The absence of variation with the obstacle present could be due to the fact that the much narrower receive time window would be closed by the time the ping energy from the front sensors made it around the external geometry and back to the left sensor.
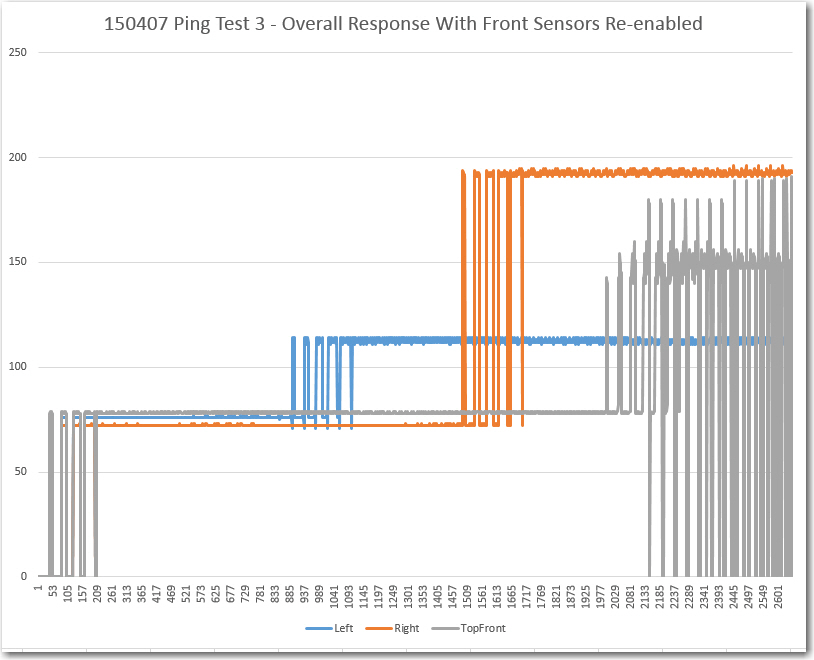
The way to definitively test this theory is to add the required ‘delay(25)’ to the code after the TopFrontPing.ping_cm() call and redo the test with all three sensors enabled.

Ping test with delay(25) added and with front ping  sensors re-enabled.

Ping test with delay(25) added and with front ping sensors re-enabled.

From the above plot it is clear that the left sensor data with its obstacle removed is still clean (or at least much cleaner).  The deviation for the period from item 1200 to item 2000 is only 3 cm, much smaller than the typical ‘stuck’ threshold of 5-10 cm.  The right sensor has a similar deviation (4 cm) for the period from 1800 to 2500.  However, the front sensor still shows extreme variation after its obstacle was removed, so there is still a problem somewhere.  This issue could be as simple as the effect of being very near the MAX_DISTANCE_CM distance from the nearest obstacle (the wall underneath my work surface).  To test this theory, I turned the robot around so it had a clear path of well over 200 cm to the nearest obstacle, and made a short run.

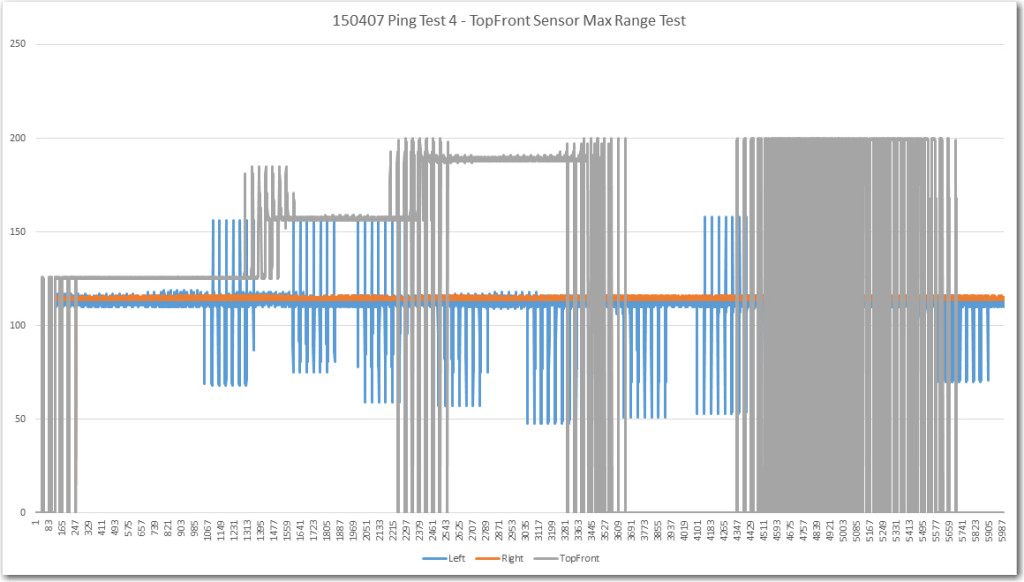
Maximum range testing for the TopFront ping sensor

Maximum range testing for the TopFront ping sensor

The test procedure that produced the above plot was to start with the obstacle placed at about 48″ (122 cm) from the sensor.  After a few seconds I moved it to 60″ (152 cm), then to 72″ (183 cm), and then I removed it entirely for a few seconds.  Next I moved it in small steps back and forth around the 200 cm (approx 78″) boundary to see if I could replicate the large variations observed in the previous trial with the front obstacle removed.  As the plot shows the front sensor (gray curve) produced quite clean data at each position, including producing a clean ‘zero’ reading when there was no object in view within 200 cm.  Also, I was able to produce a reasonable simulacrum of the large varations seen when the object is right on the 200 cm boundary.  Note that the large variations in the left side sensor readings (blue trace) is due to me walking by it in order to reposition the front obstacle, and of the large deviations in the front sensor readings are due to me moving the obstacle.  The large variations in the front sensor toward the end of the recording are due to the obstacle being placed right on the 200 cm boundary.

So, I think the testing in Part II and IV has completely answered the question of why Wall-E’s ‘stuck’ detection scheme was misfiring so badly in my field tests.  The culprit was cross-contamination between the front and left-side sensors due to the lack of proper time spacing between those two ping() calls.  In addition, I believe the data convinces me that there is no good reason to change the MAX_DISTANCE_CM parameter from its present value of 200 cm.  It is clear that all 3 (or 4) sensors can easily measure that far out with 1-2 cm repeatability, and a lower range limit would just increase the frequency of occurrence of  obstacles passing through the max range transition area.

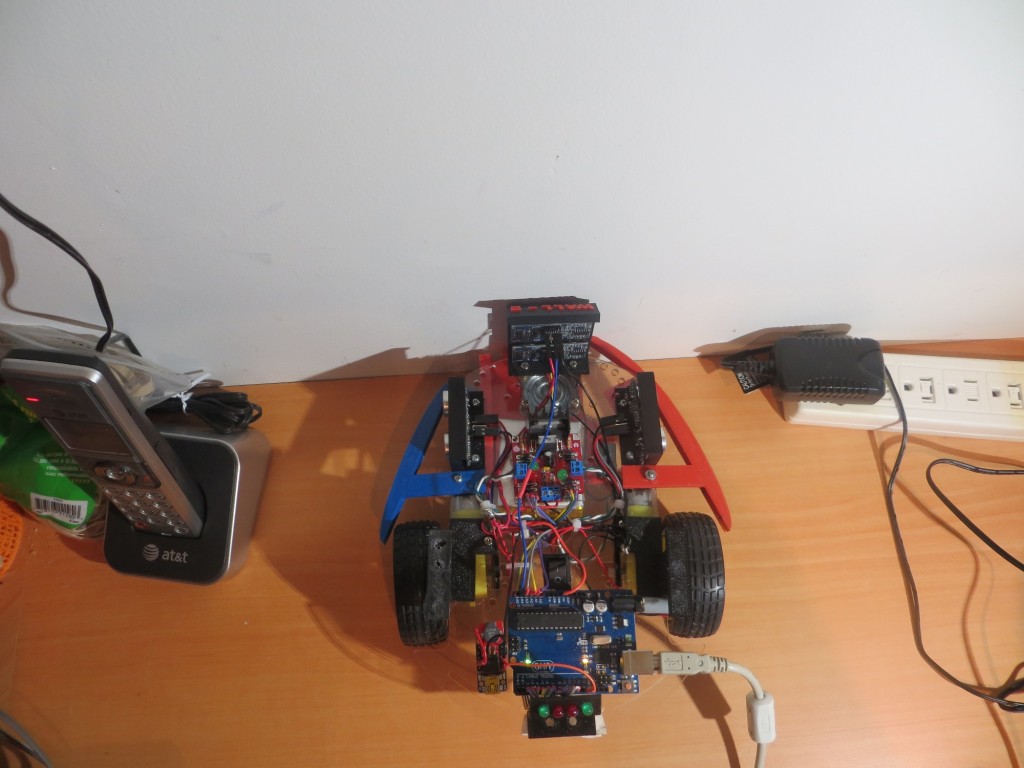
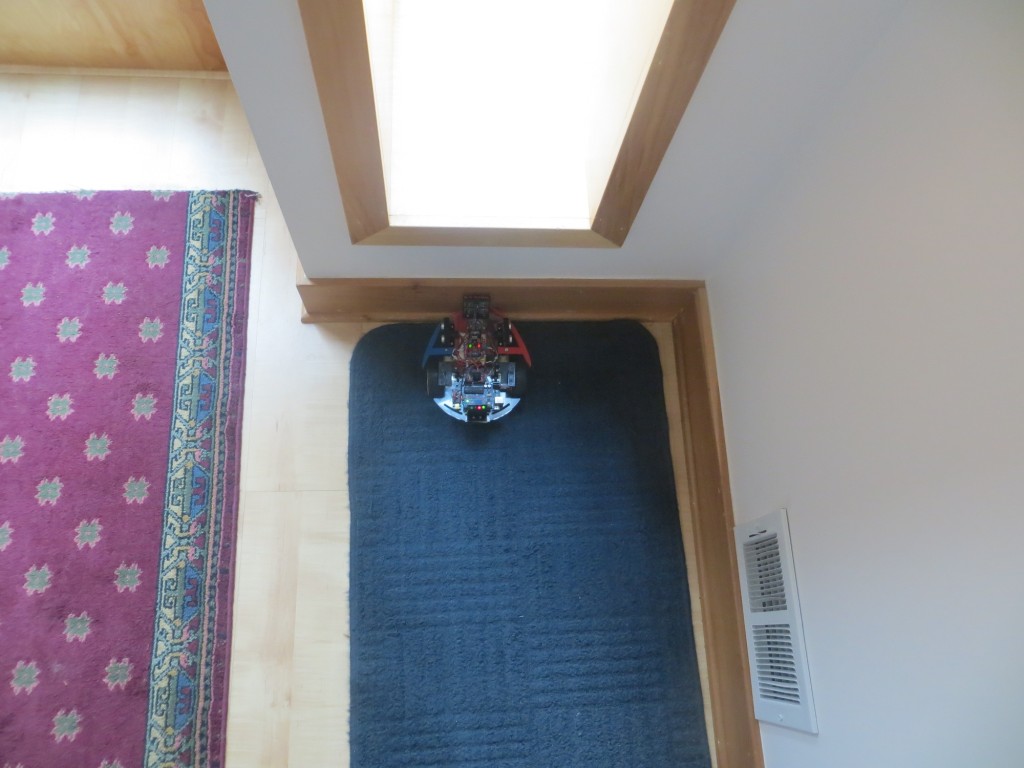
One test remains – the Wall-E ‘head-butt’ configuration where Wall-E has his nose right up against an obstacle. This doesn’t  normally occur, as the  default obstacle avoidance procedure is to back up and turn around whenever an obstacle comes within about 10 cm of the forward sensor.  However, when I was field testing the ‘stuck’ detection scheme, I disabled the default obstacle avoidance routine, allowing Wall-E to get stuck by running directly into a forward obstacle (like a wall).  So, in the interests of completeness, I want to make sure I understand what that condition does to  the forward sensor data.  To test this, I placed Wall-E with its forward sensor bracket directly against a wall, just as if it had driven into it.  Then I recorded enough data to make a good determination of the effect.

Wall-E in the 'Head Butt' configuration

Wall-E in the ‘Head Butt’ configuration

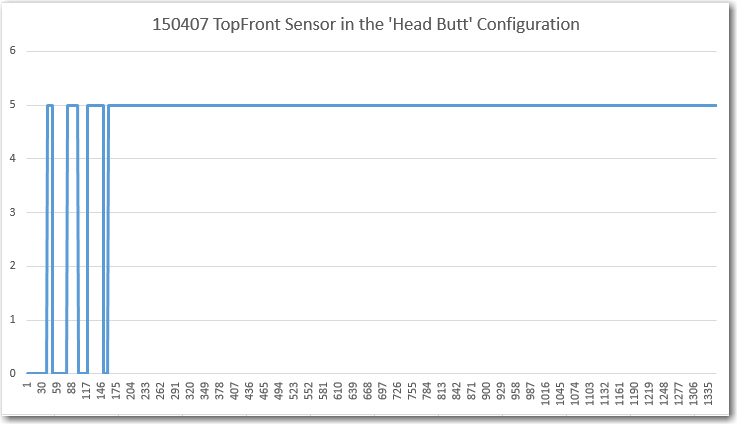
Wall-E TopFront Sensor Response in the 'Head Butt' Configuration

Wall-E TopFront Sensor Response in the ‘Head Butt’ Configuration

As can be clearly seen in the above plot, Wall-E does quite nicely in the ‘Head Butt’ configuration, returning a constant 5 cm reading.  This is in error by at least 4 cm (not sure where the actual measurement center is on the transducer), but there’s no doubt that this configuration would easily meet the deviation threshold requirements for ‘stuck’ detection.

In summary, I now think I have a very good (if not quite complete) understanding of the salient characteristics of the SR-04 ping sensors, their interaction with the NewPing driver library, and their performance in multiple installations on the Wall-E robot.  I’m now convinced that the ‘stuck’ detection scheme will work quite nicely with a 200 cm MAX_DISTANCE_CM setting.  It’s  way too late tonight to do the required follow-up field testing, but I’m now very confident that when I do them, they’ll be successful.

Frank

New ‘stuck’ Detection Scheme, Part III

Posted 04/06/15

In the last episode of the ‘stuck’ detection saga, I added a second forward-looking ping sensor above the existing one, on the theory that this would help address  the ‘stealth slipper’ issue.  However, field trials with the new system didn’t really show much improvement – Wall-E still gotstuck and couldn’t seem to figure it out without help.

To try and clarify what was going on, I disabled the normal forward obstacle avoidance maneuver that is triggered whenever Wall-E gets within about 10cm of an object.  This caused the robot to run right into forward obstacles without stopping.  The idea was to see if the ‘stuck’ detection algorithm would take over and get Wall-E free.  As it turned out, the robot would simply sit there forever with its nose pushed firmly up against whatever it was stuck on.

Classic Wall-E 'Nose Plant' position

Classic Wall-E ‘Nose Plant’ position

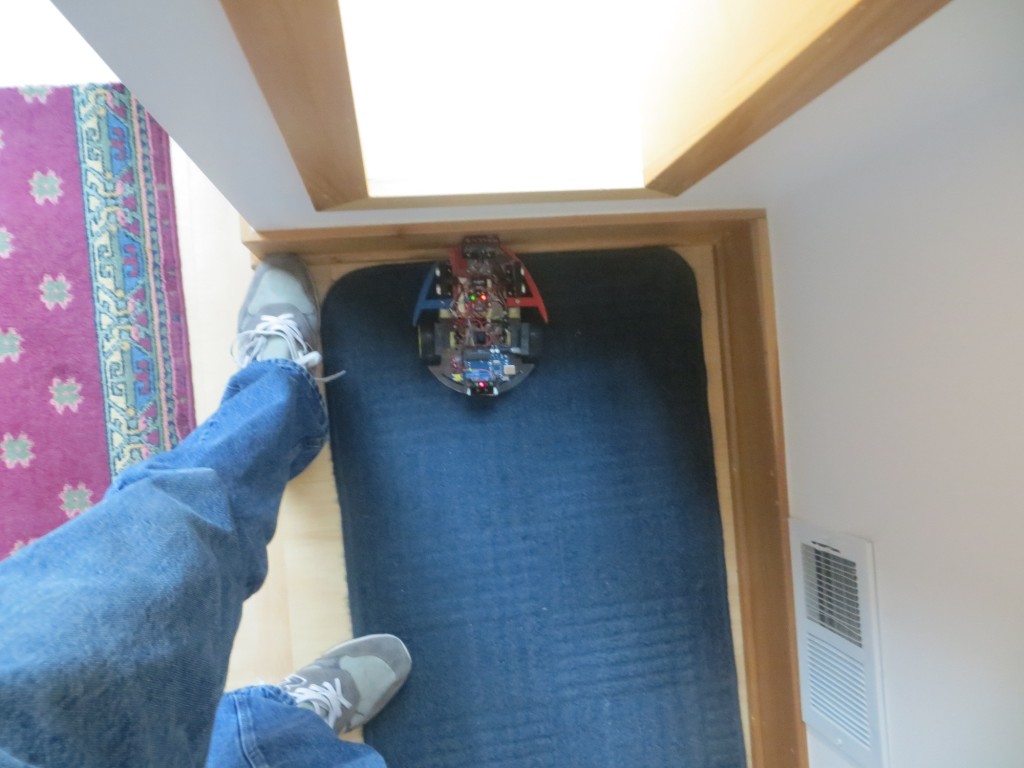
The ‘stuck’ detection algorithm was designed to trigger when the variation in distance readings from the left, right, and top-forward sensors falls below a settable threshold, as  should be true whenever Wall-E gets stuck.  In the field trials, this seemed to be exactly what was happening, except Wall-E never figured it out.    After scratching my head about this for a while, I noticed that I could  sometimes  trigger Wall-E’s ‘stuck’ detection routine by placing a foot in the field of view of one of the side sensors, typically the one on the opposite side from the nearest wall, as shown below.

This sometimes triggered the 'stuck' detection routine

This sometimes triggered the ‘stuck’ detection routine

This technique wasn’t terribly consistent, but it did work enough times to make me think that I was on to something.   I began to think that the ‘offside’ sensor distance readings contain sufficient variability to defeat the ‘stuck’ detection algorithm, even though the geometry is completely static, and the sensors are  supposed to report 0 if the nearest obstacle is beyond the preset distance limit (200 cm in my case).

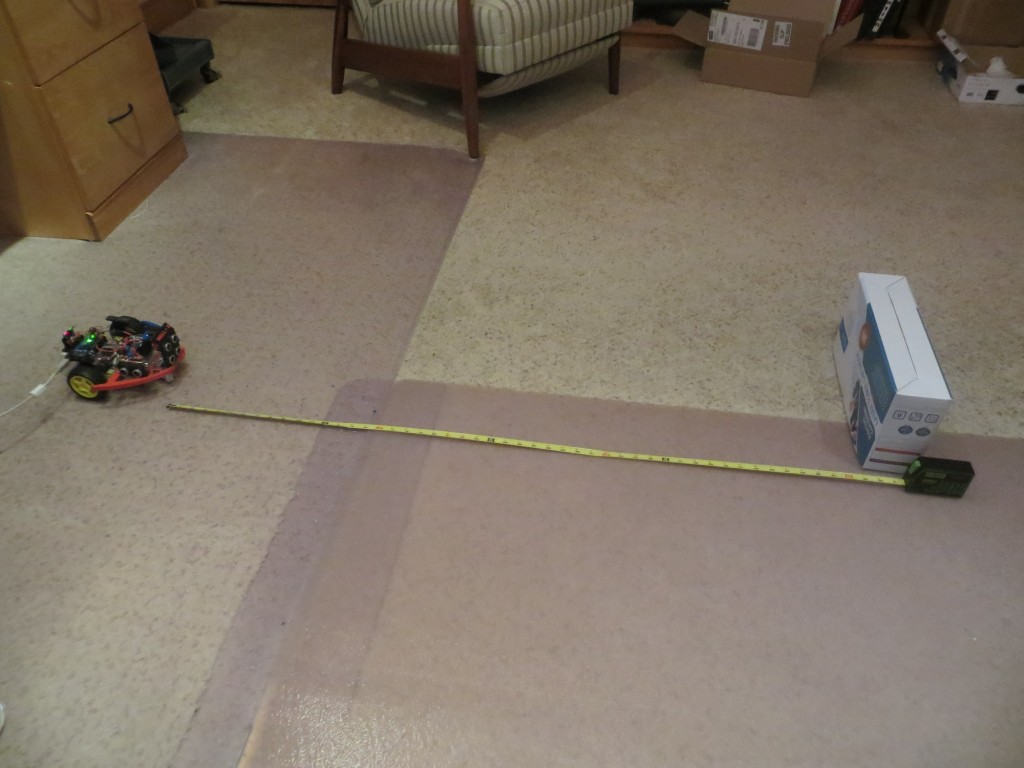
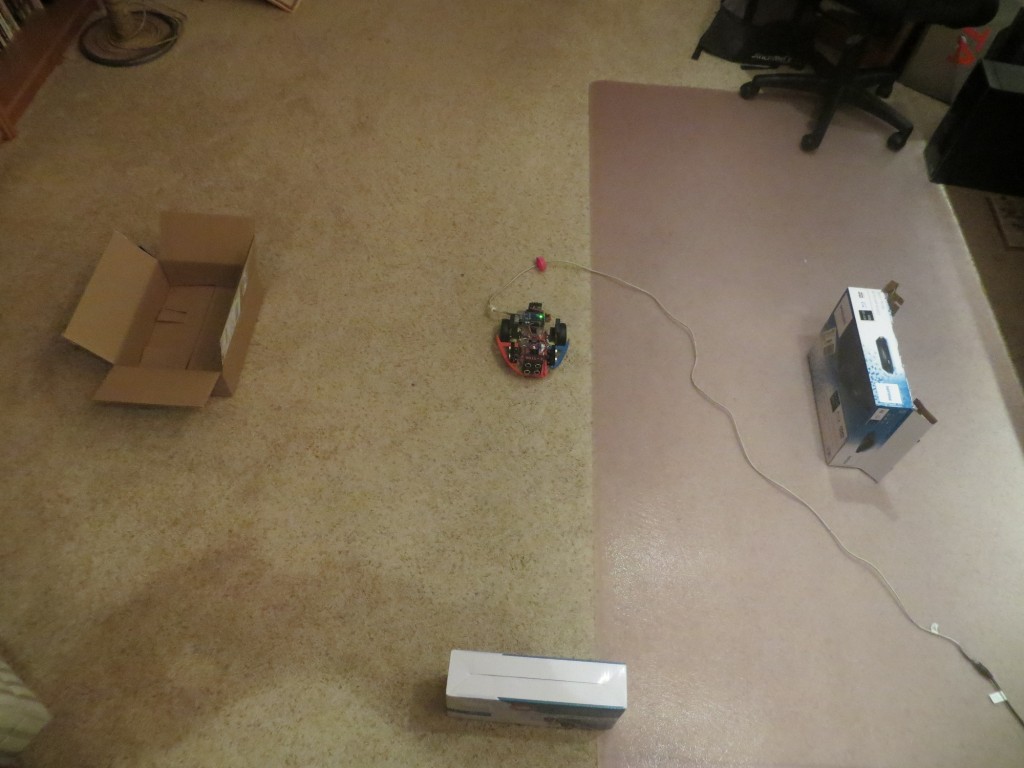
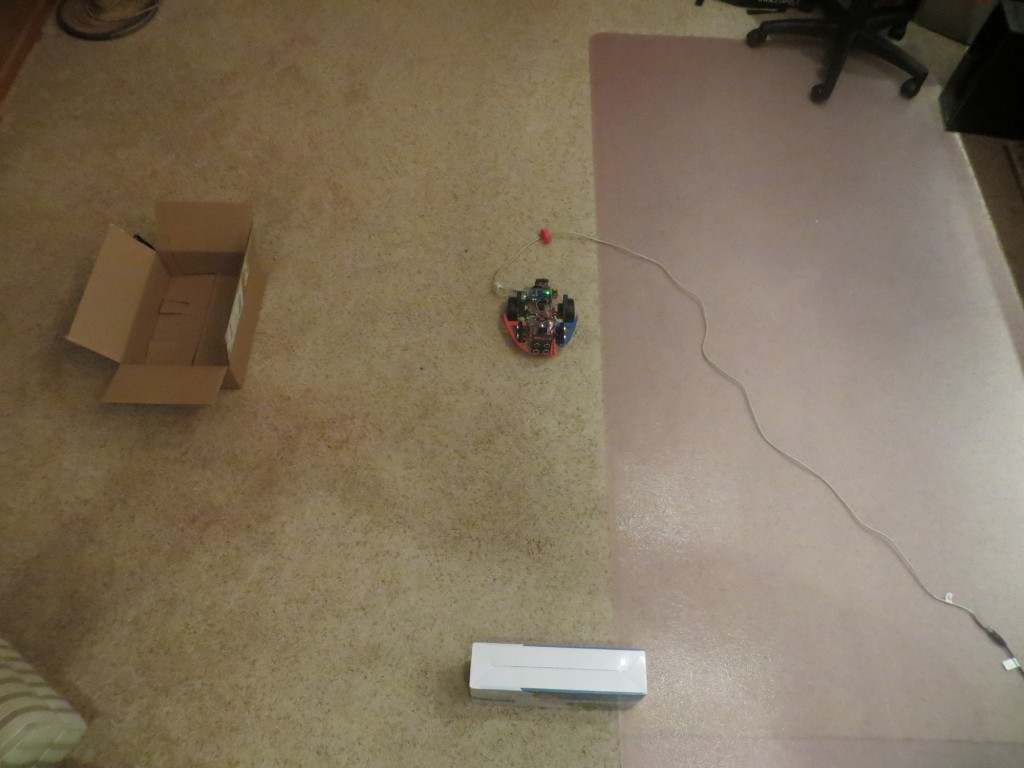
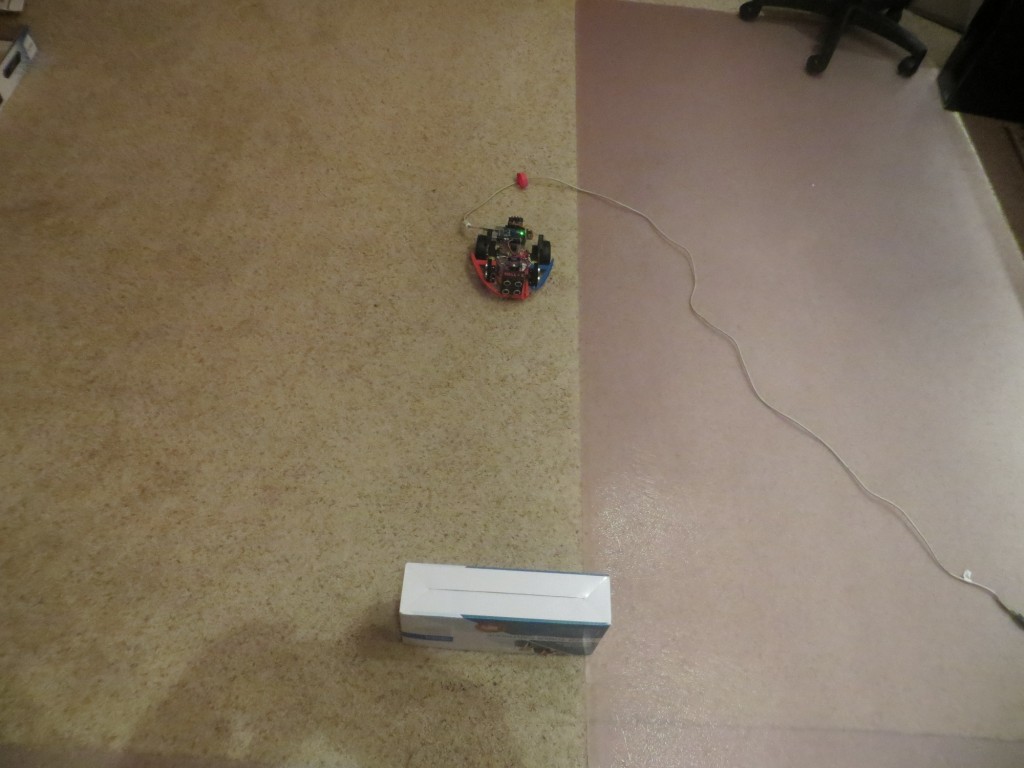
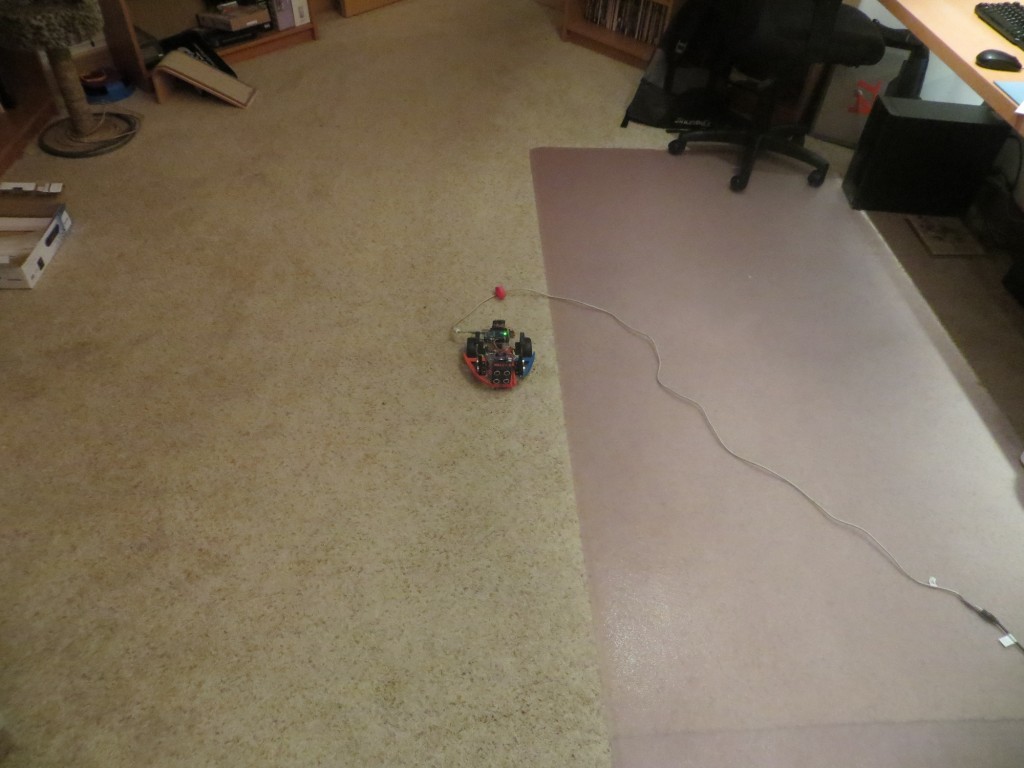
After trying various combinations in the field trials, I decided to try to set up a more rigorous testing environment.  So, I connected Wall-E to my PC using a longish USB cable and set him on the floor of my lab, in a position where all four ping sensors were clear of obstacles for at least 200 cm.   The use of the USB cable also allowed me to power the Arduino without powering the motors, thereby eliminating a set of variables.  Then I placed an acoustically solid obstacle at various distances away from the front sensor and watched what happened.

The Wall-E Indoor Acoustic Sensor Test Range

The Wall-E Indoor Acoustic Sensor Test Range

What I discovered was that Wall-E, when left alone with nothing in range of any ping sensor, will never declare itself stuck, even when it is clearly sitting still (motor drives disabled)!  However, if there is an object within range of  any sensor, then it will shortly detect the ‘stuck’ condition.

The clear implication of this observation is that the sensor response with nothing in view is not constant, but has sufficient variation to overwhelm  the ‘stuck’ detection algorithm.  This appears to be  contrary to the NewPing library specification, which states that the response to a ping where there is no object within the specified max detection range will be constant (zero, actually).  OTOH it is possible that my current 200 cm max range specification is too large, and what is happening is intermittent detection of objects that are nearly 200 cm away, and sometimes a zero is returned and sometimes not.

The only direct way to clear up the mystery is to look at the actual ping sensor data in the ‘no object in view’ case and see what is returned.  To do this I will probably need to create a specialized Arduino program to take the data and then report it.

So, I created a new Arduino sketch called ‘PingTest1’ (clever name, huh?) that simply reports the contents of the left, right, and top-front ping sensor  arrays  about once per second.  This data was then sucked into Excel and graphed.  Four different physical configurations were tested, in the following order:

  1. Obstacles at about 75 cm in view of all three sensors (Figure 1)
  2. Left obstacle removed (Figure 2)
  3. Left and right obstacles removed (Figure 3)
  4. All three obstacles removed (Figure 4)
Obstacles at about 75 cm From Left, Right, and Front Sensors

Obstacles at about 75 cm From Left, Right, and Front Sensors

Left Obstacle Removed

Left Obstacle Removed

Left and Right Obstacles Removed

Left and Right Obstacles Removed

All 3 Obstacles Removed

All 3 Obstacles Removed

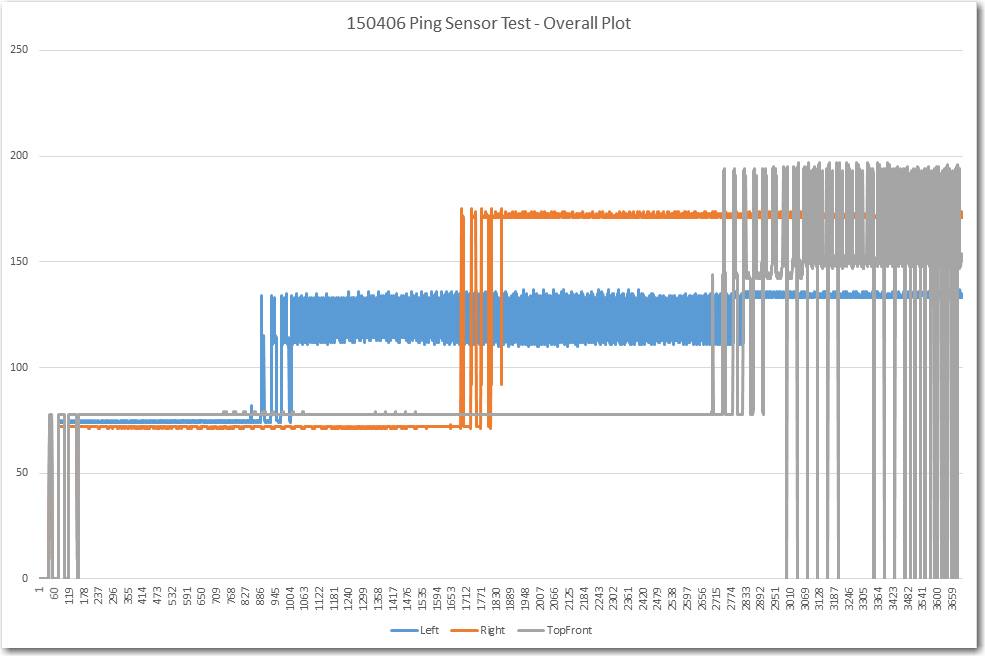
This produced the overall plot shown below.  The first 200 or so data points show the process of replacing the initial zero state of the distance arrays with real values as they are acquired.  The left obstacle is removed at about item 1000, the right obstacle at about item 1700, and the front one at about 2800.

Overall plot of approximately 3600 sets of sensor readings

Overall plot of approximately 3600 sets of sensor readings

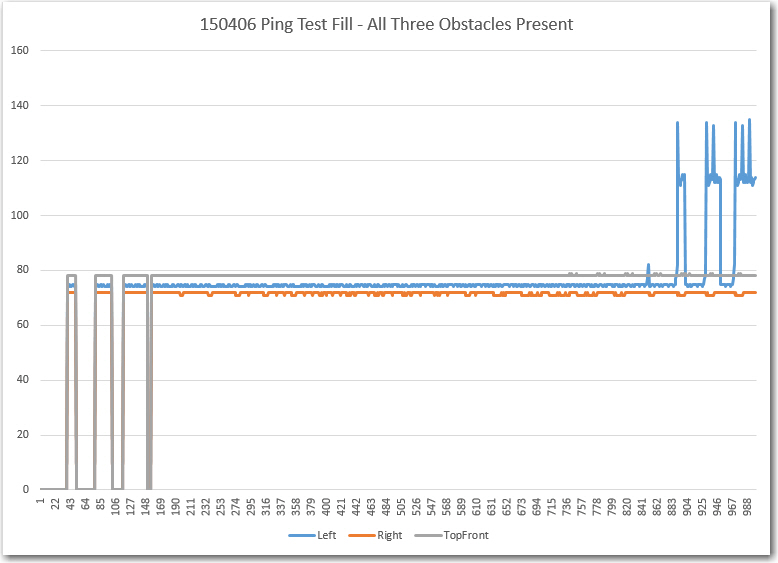
First 1000 or so points, showing the fill procedure and the response with all 3 obstacles present

First 1000 or so points, showing the fill procedure and the response with all 3 obstacles present

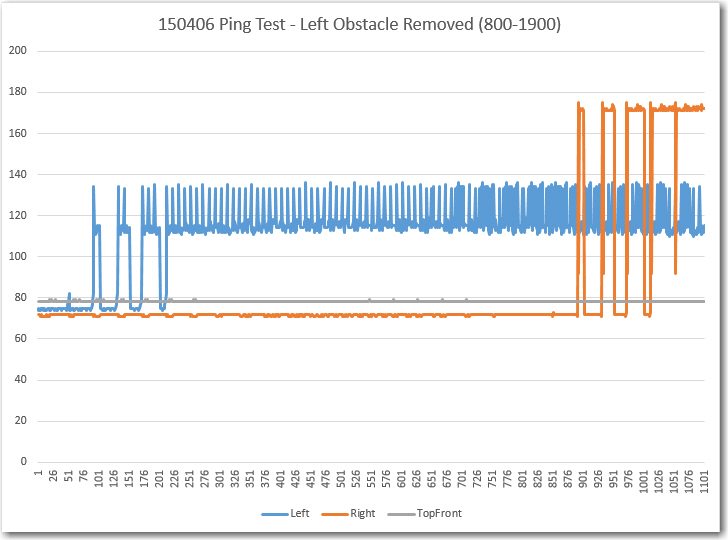
From about 800 to 1900, showing the responses with the left obstacle removed

From about 800 to 1900, showing the responses with the left obstacle removed

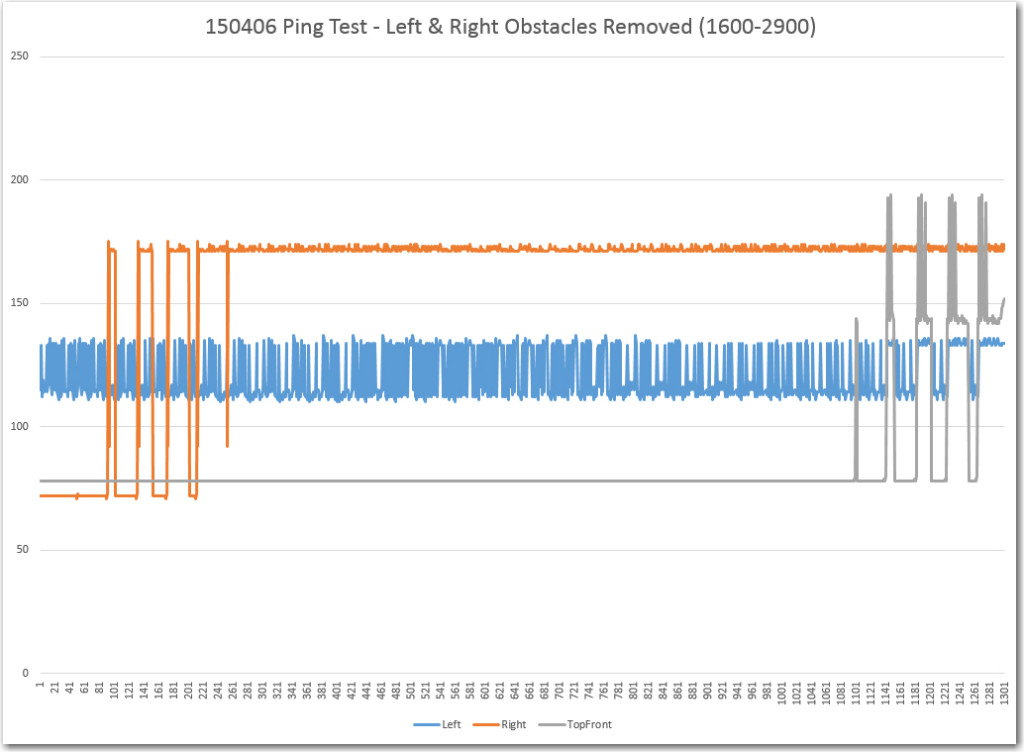
From 1800 or so to 2900, showing the Left and Right obstacles removed

From 1600 or so to 2900, showing the Left and Right obstacles removed

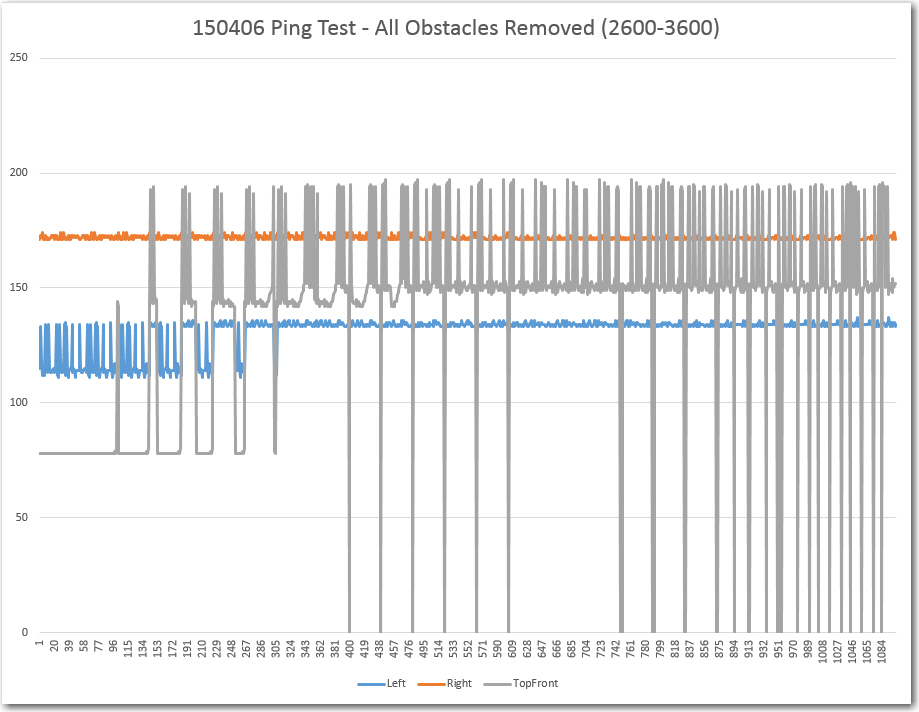
From about 1900 to 3600, showing the responses with all 3 obstacles removed.  Note the large variations returned by the top front ping sensor

From about 2600 to 3600, showing the responses with all 3 obstacles removed. Note the large variations returned by the top front ping sensor


My general impression after looking at this data was “What a mess!”.  I’ll never be able to detect a ‘stuck’ condition with all this variation, especially the HUGE (over 50 cm) high-frequency variation  in the top front distance readings, not to mention the less frequent (but no less disastrous) rail-to-rail excursions from nearly 200 to 0 and back again.  However, there are some features about this data that make me think I’m not completely out of luck.  The response with all three obstacles present is quite clean – with less than 2 cm variation on all three channels.  I believe this section explains why I was occasionally able to get Wall-E to detect the ‘stuck’ condition if I placed an obstacle (my foot) in view of whichever side sensor was ‘staring off into space’.  It also explains why I had to use  both  feet when both the left and right sensors had no nearby wall features in view.  By inserting an obstacle into the sensors’ view, I was moving the configuration from the right side of the overall plot above, with all its ugly variation, to the left side where the data is nice and clean with very little variation over time.

However, I’m at a complete loss to explain the large variation in the left sensor distance measurements with the left obstacle removed.   I can rationalize the mean number of about 120 cm as coming from items under my work surface on the left side, but all that stuff is  static – no movement at all!  When the right obstacle is removed, it’s readings jump from about 75 to about 175 cm, consistent with the distance to my bookcase on that side,  and the readings continue to be quite clean – less than 4 cm variation across the entire period.  Then there is the double (or is it triple) mystery of what happens when the front obstacle is removed.  The front distance reading goes from about 75 to about the same average as the right sensor, but the variation is HUGE – 50 cm or more!  And just to add to the mystery pile, the variations in the left sensor distance readings largely disappear – how can that possibly happen?  It actually looks like there is some relationship between the removal of the front obstacle and the disappearance of the variation from left sensor readings – how can that be?  Is there some external feedback between the front and left sensors that isn’t present between the front and right sensors?  Could the ping timing be such that a ping is emitted from the front sensor, bounces off the front obstacle and then some objects in the field of view of the left sensor, arriving at the left sensor just in time to look like a valid echo?  I think I’m getting a headache! ;-).

Although this data raised as many questions as it answered, it is definitely a step in the right direction.  Now I need to repeat this experiment with some modifications, as follows:

  • Do the same experiment with the front ping sensors disabled, to eliminate the possibility of echo contamination between the front and left and/or right sensors.
  • Look at the front ping sensor response when Wall-E’s nose is pressed up against a wall.  This won’t normally be an issue, as Wall-E’s normal obstacle avoidance routine will make it stop and turn around when it gets within about 10 cm of an obstacle, but I have disabled that while trying to work out the ‘stuck’ detection issues. So, I need to understand just what is happening in this case.
  • Change the MAX_DISTANCE_CM parameter from 200 to 100.  It is clear to me from my lab ‘indoor test range’ experiments that 100 cm in each direction is more than enough to handle almost all situations in my house, and if this change eliminates the wild variations with no object in view, so much the better.

More to come,

Frank