Posted 17 September, 2015
After getting the improved tachometer assembly integrated into Wall-E’s spinning LIDAR setup, I decided to repeat the hallway field testing that I performed back in July of this year (see this post for the details). My ‘theory of navigation’ for wall following is that I should be able to determine Wall-E’s orientation relative to a nearby wall by looking at where the spinning LIDAR’s minimum distance measurement occurs relative to Wall-E’s ‘nose’.
Just as I did back in July, I placed Wall-E a short distance away from a long straight wall, in three different orientations – parallel, 45-deg nose-in, and 45-deg nose-out. For each of these orientations I let the spinning LIDAR ‘look’ at the wall for about 10 revolutions, and then I manually changed the orientation. The distance and angle (actually the interrupt number, but that is the same as the angle) values were recorded in a text log.
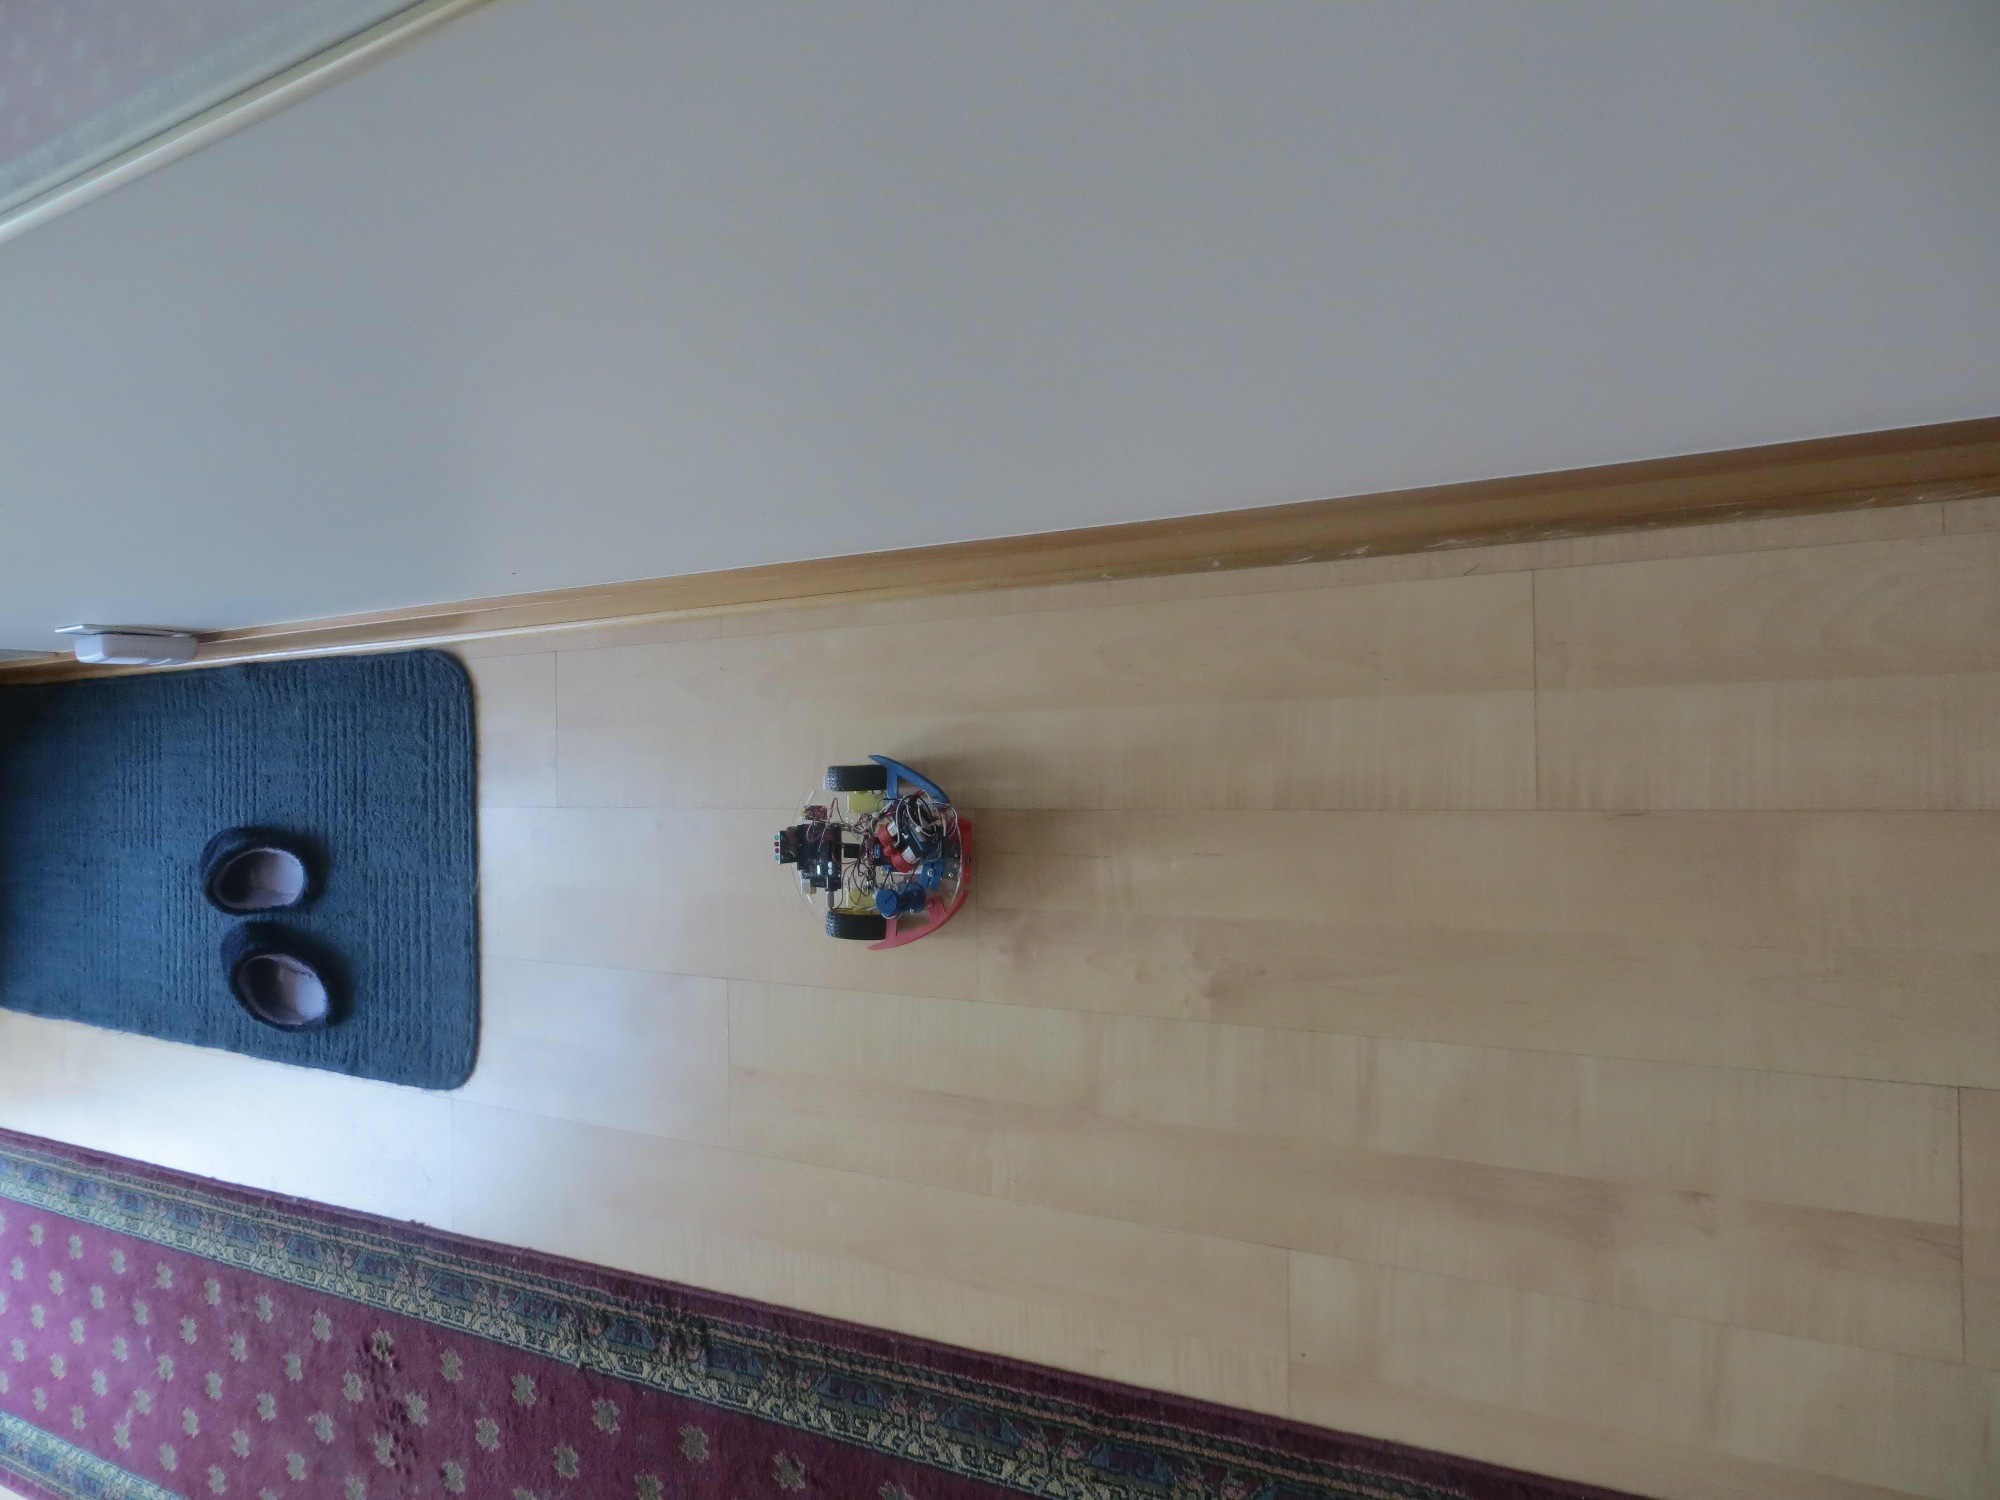
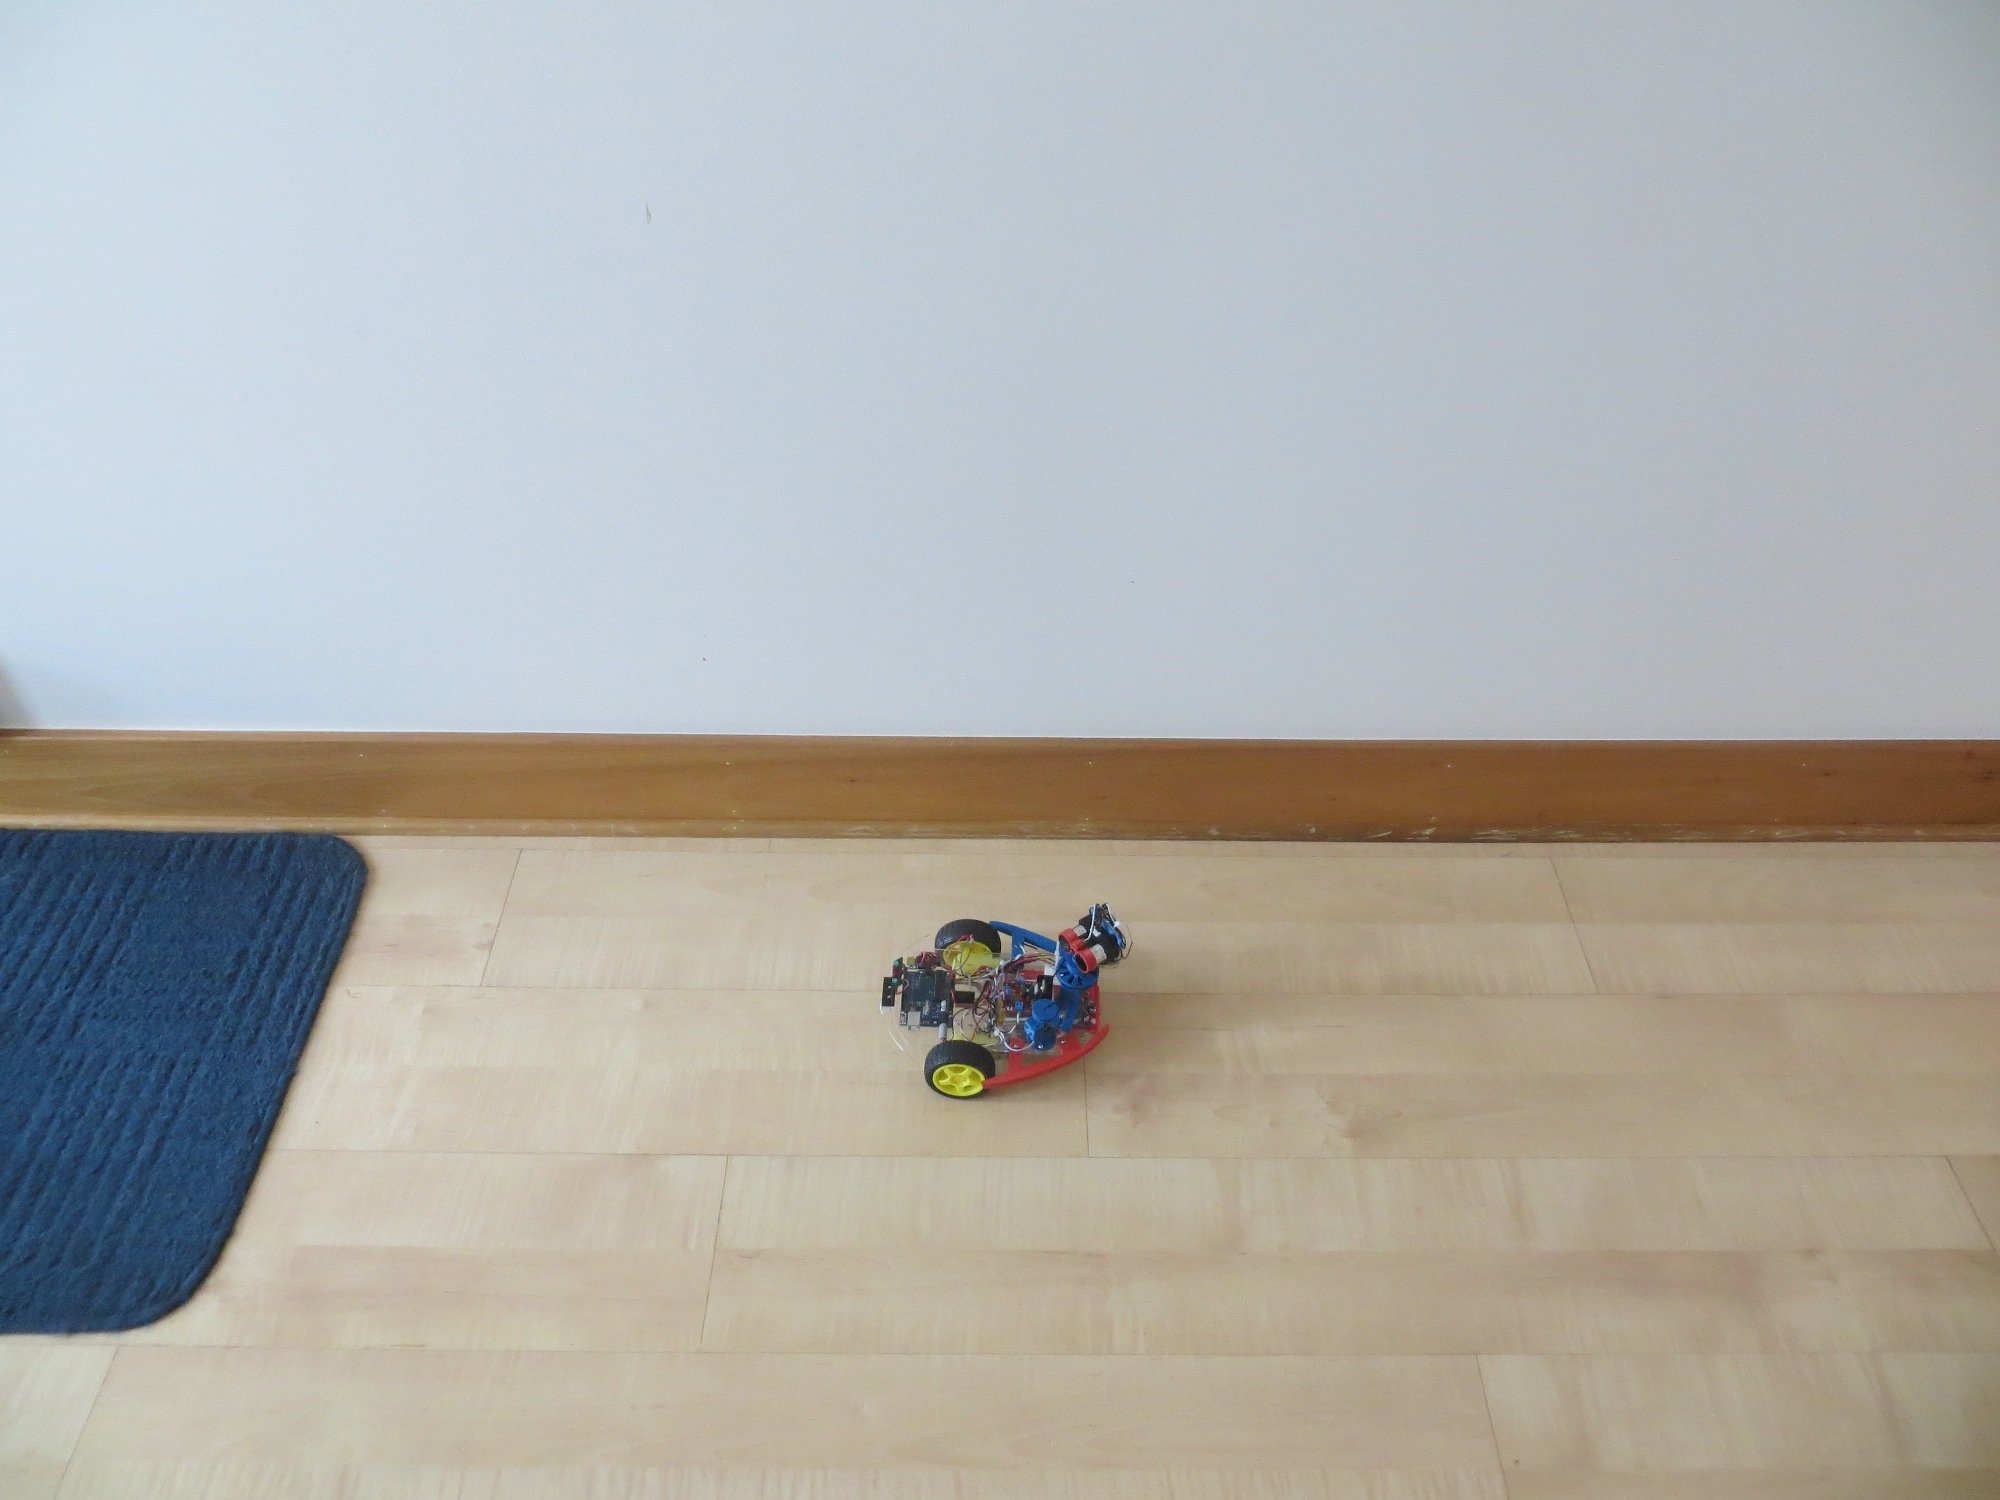
The LIDAR Field Test Area. Note the dreaded fuzzy slippers are still lurking in the background
Wall-E oriented at approximately 45 degrees nose-out
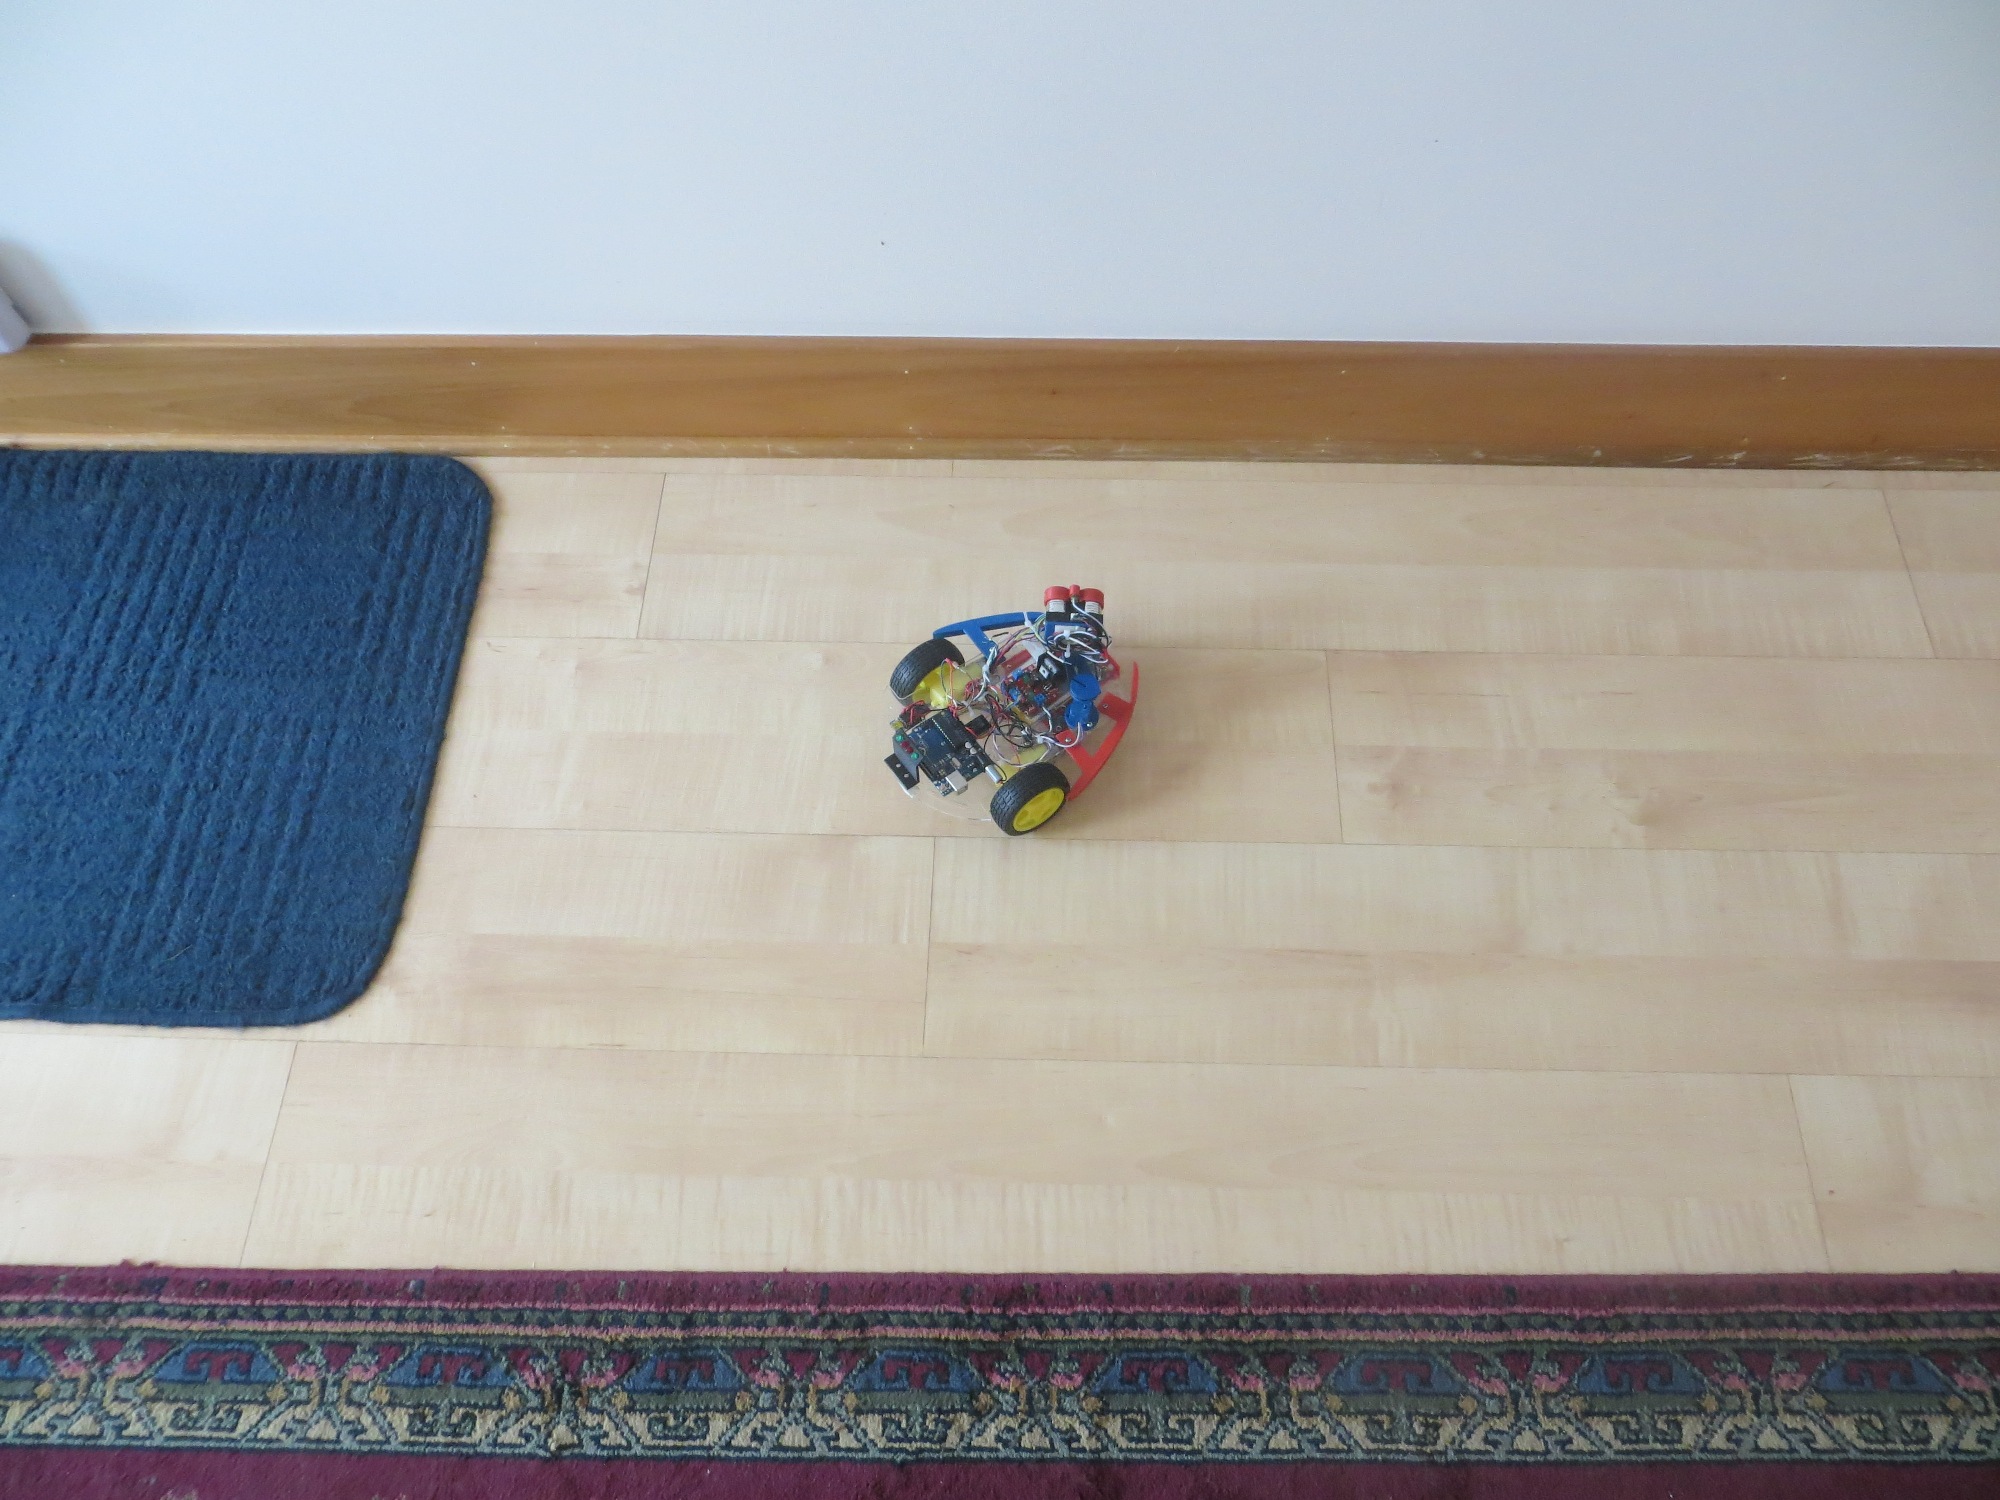
Wall-E oriented at approximately 45 degrees nose-in
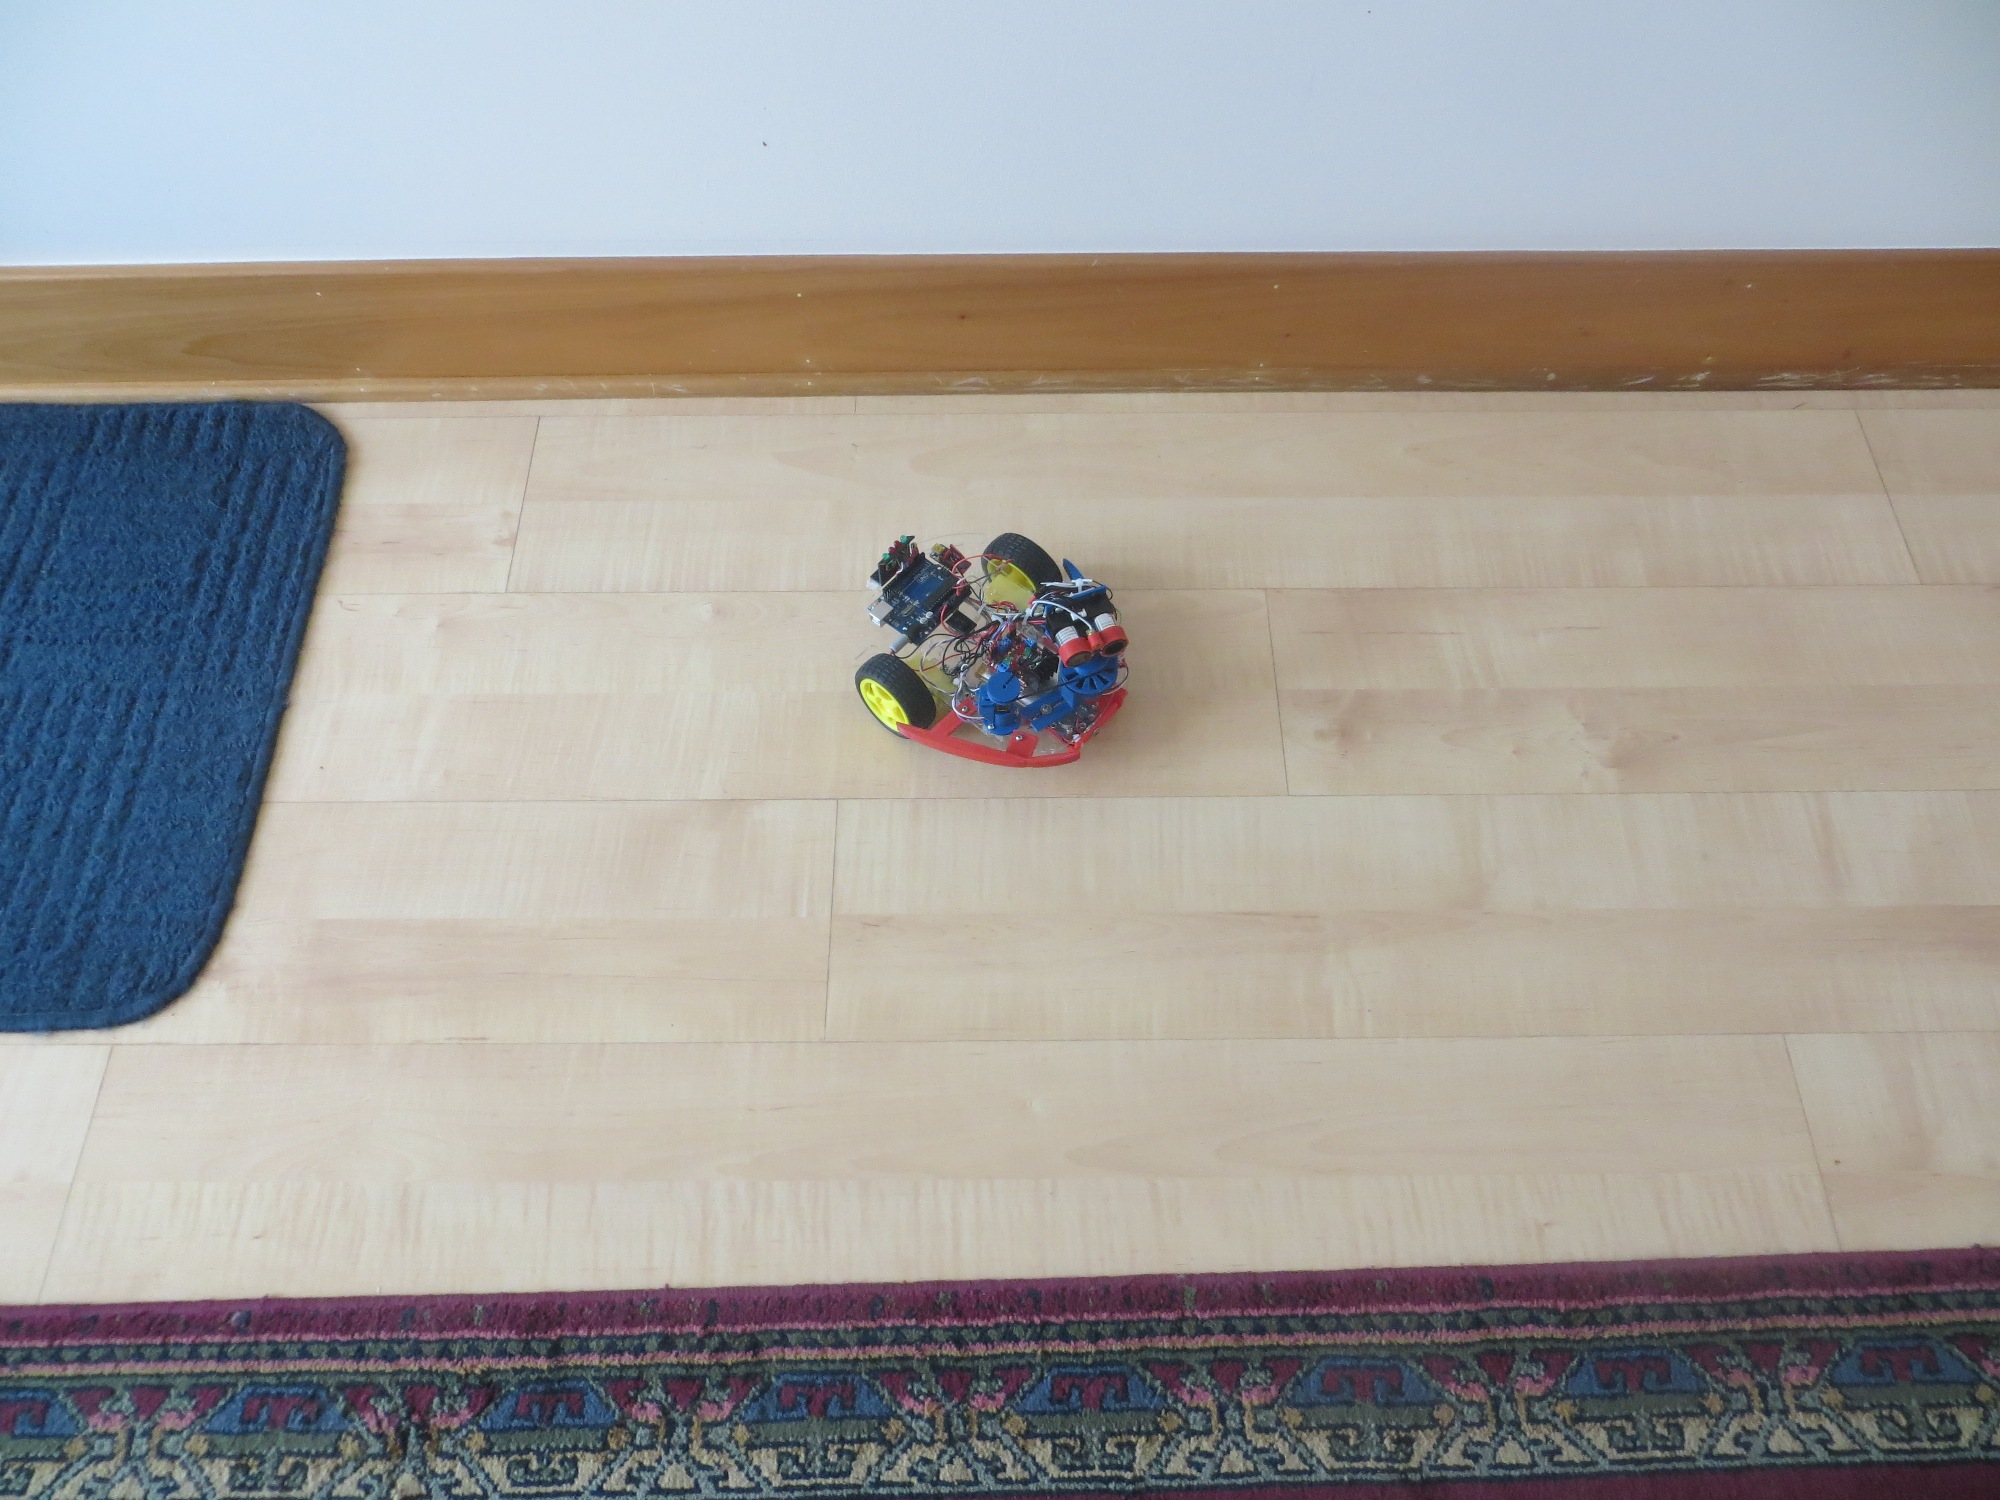
Wall-E in the ‘parallel’ configuration
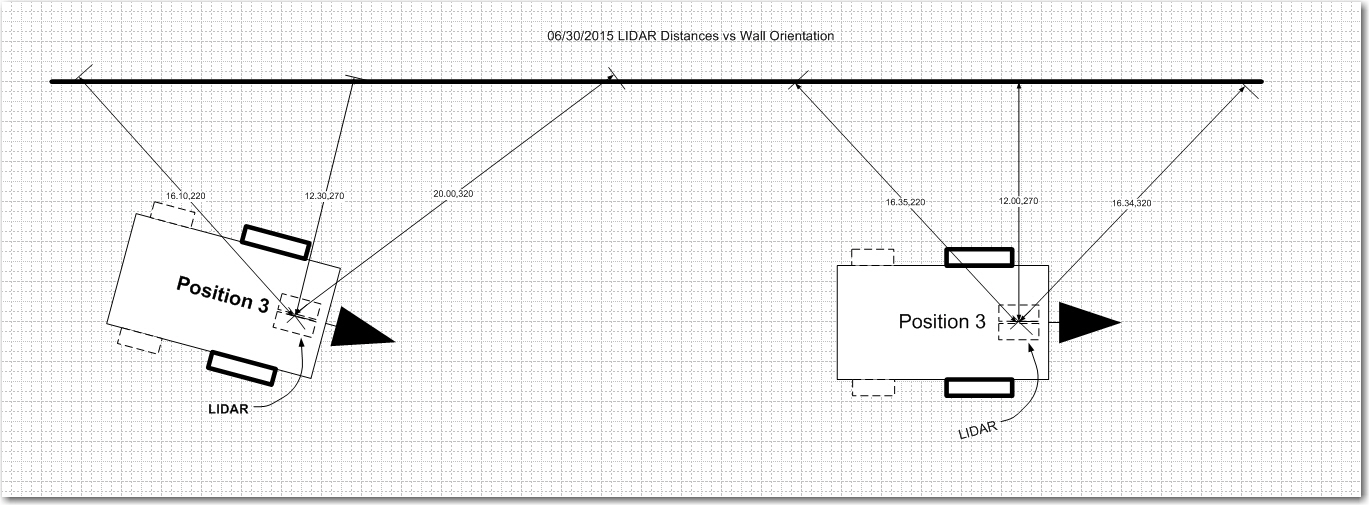
LIDAR distance measurements to a nearby long wall
The text log was arranged as shown in the following screenshot.
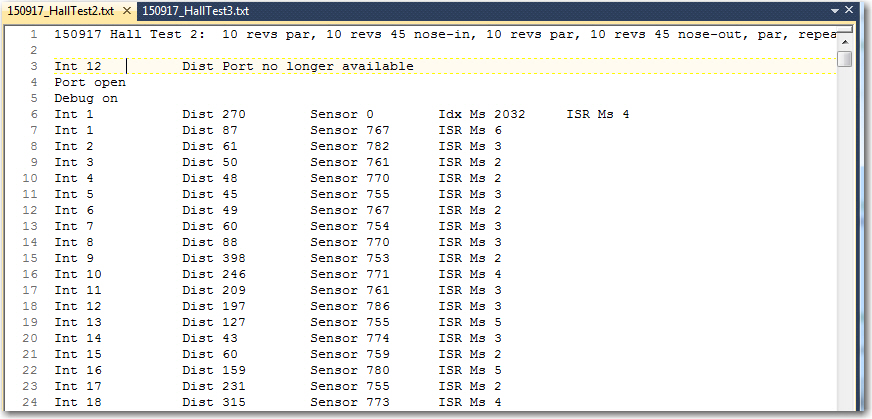
A small portion of the data log for the wall orientation test. Note the line at the top describing the orientation sequence
Next, I wrote an Excel VBA script to parse the text log file and extract just the half of each revolution where the LIDAR was scanning the nearby wall, skipping over the half. For each such scan, I searched the distance data for the minimum value, capturing that value and its associated interrupt number (i.e. angle). All the extracted distance values and the min dist/min angle numbers were written to the spreadsheet, and then I plotted the mininum distance interrupt number (i.e. angle) vs rev number for about 90 LIDAR revolutions.
If my theory holds water, then I should be able to see variations in the minimum interrupt number over time that corresponds to the orientation changes. As shown in the following plot, that is exactly what happens.
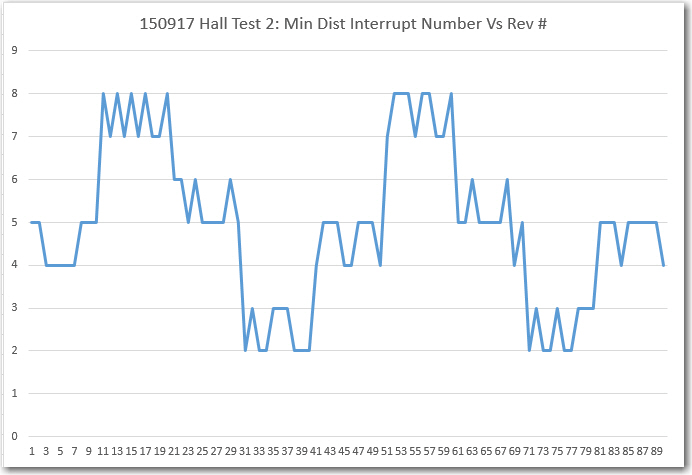
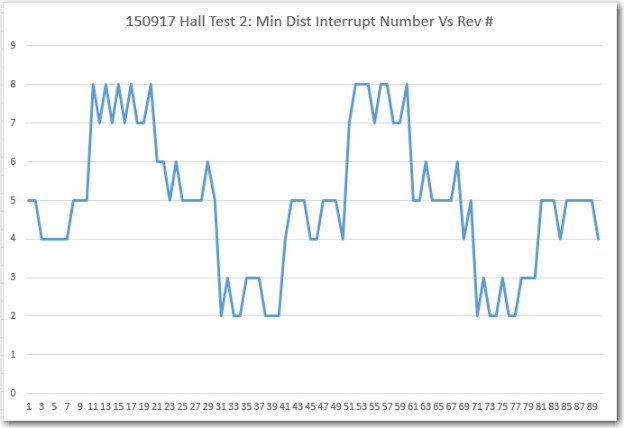
Excel plot of the interrupt number corresponding to minimum distance vs rev number
As can be seen in the above plot, the Min-Dist-interrupt (MDI) starts out between 4 and 5, and stays there for the first 9-10 revolutions. At about rev 11, it jumps to the 7-8 range, where it stays until about rev 20. The it drops back to 5-6 for 10 revs, and then drops again to the 2-3 range. This pattern then repeats for the duration of the plot. In my current spinning LIDAR configuration, Interrupt 1 starts at Wall-E’s tail, and proceeds along Wall-E’s left side to interrupt 10 at the nose. So, an MDI of 4-5 should correspond to the parallel orientation, while a lower number should correspond to nose-out and a higher one to nose-in. From the test condition description, Wall-E was placed parallel for 10 revs, then nose-in for 10, then nose-out for 10, then back to parallel, repeat. It is clear from the plot that the actual behavior of the MDI matches the predicted behavior quite nicely – EUREKA!! ;-).
Although the above test results are quite encouraging, it is still not entirely clear that this technique can actually be used for effective navigation at practical travel speeds. There is undoubtedly some correlation between the spinning LIDAR rotation rate and the maximum travel speed at which the LIDAR can provide information fast enough for effective steering. For instance, the NEATO XV-11 spinning LIDAR system rotates at about 300 RPM (5 RPS), and it seems to travel no faster than about 1-2 m/sec. This might mean that my 120 RPM (2 RPS) spin rate would only support travel speeds in the 0.5-1 m/sec range. In addition, my current 18-degree resolution may be too coarse for effective steering. Again using the XV-11 as a baseline, it has a resolution of 1 degree, 18 times mine. With the much faster speed of the new V2 ‘Blue Label’ Pulsed Light LIDAR, I could probably double or even triple my current angular resolution, but 18X might be a bit much ;-).
Next up – analyzing the data from a simulated navigation test, where I manually pushed Wall-E along the hallway, simulating as close as possible how I think Wall-E might navigate, assuming the spinning LIDAR data is fast enough and accurate enough. As I moved Wall-E along, I recorded the same distance and interrupt number data as before, so it will be interesting to see if this data continues to support my current ‘theory of navigation’ – stay tuned!
22 September 2015 Update: The data from the simulated navigation test was a mess – nothing recognizable as a pattern. The one thing it did do was convince me that the ‘angle of least distance’ idea wasn’t going to work – and that something else was going to have to be done. What, I don’t know yet…
Frank