July 25, 2015
In my last LIDAR-related post (http://gfpbridge.com/2015/07/lidar-field-test-with-eeprom/), I described a test intended to study the question of whether or not I could use LIDAR (specifically the Pulsed Light spinning LIDAR system on Wall-E) to determine Wall-E’s orientation with respect to an adjacent wall, in the hopes that I could replace all the former acoustic sensors (with their inherent mutual interference problems) with one spinning LIDAR system. In a subsequent field test where I used LIDAR for navigation, Wall-E fared very badly – either running into the closest wall or wandering off into space. Clearly there was something badly wrong with either the LIDAR data or the algorithm I was using for navigation.
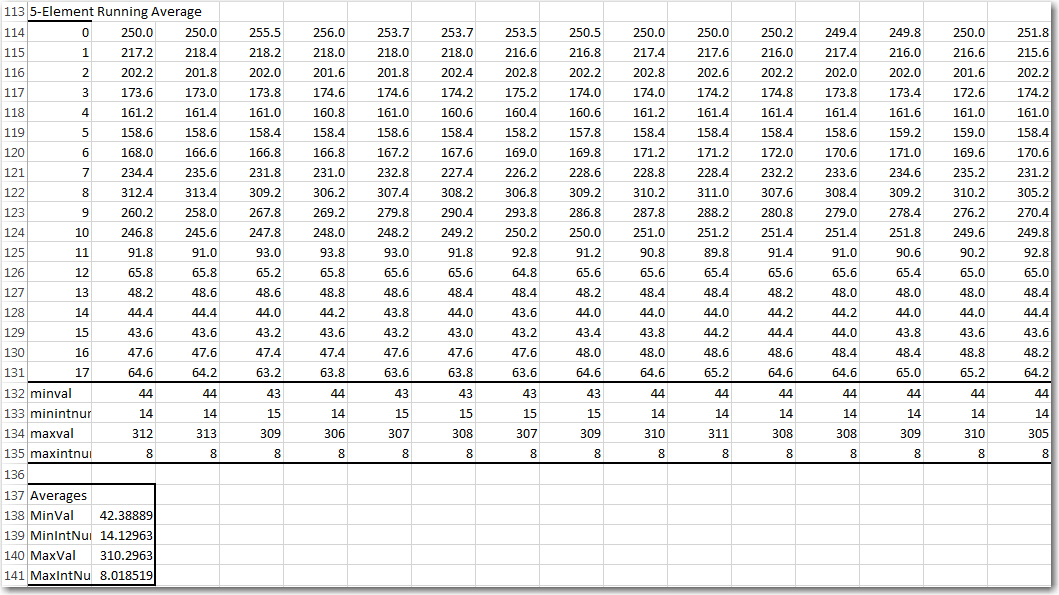
This post describes the results of some follow-on testing to capture and analyze additional LIDAR data from the same hallway environment. In the last test, I used the Arduino Uno’s EEPROM to store the data, which meant I was severely limited in the amount of data I could capture for each run. In this test I instead ran the program in DEBUG mode, with ‘Serial.print()’ statements at strategic locations to capture data. To avoid contaminating the data with my presence, I ran a USB cable out an adjacent door. I placed Wall-E in about the same place as in the previous post, oriented it parallel to the wall, and started collecting data after I was safely on the other side of the adjacent door. I collected about 30 seconds of data (50 or so 18-point datasets) to be analyzed. The screenshot below shows some of the raw LIDAR data plus a few interesting stats.
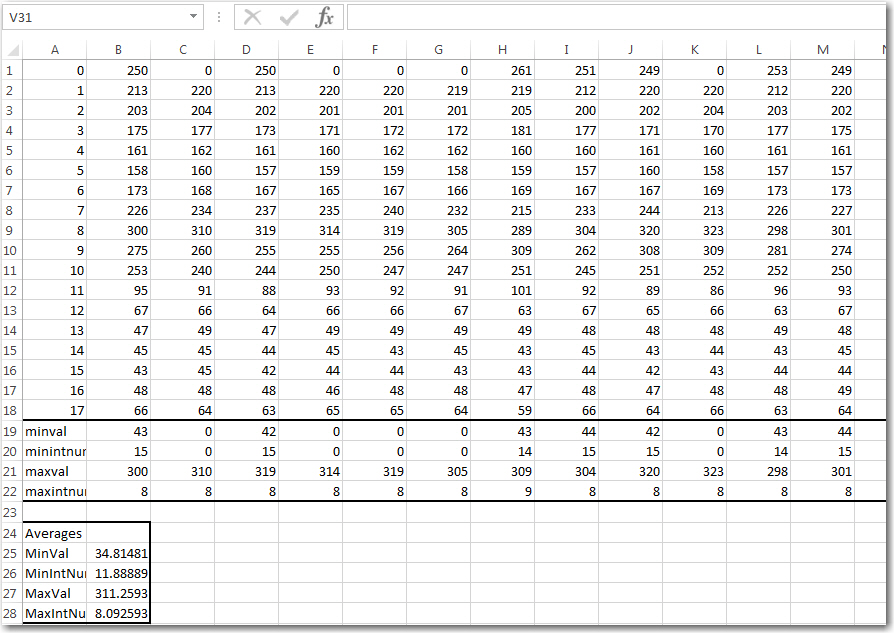
Screenshot showing raw LIDAR data with some stats
Looking at the raw data it was immediately clear why Wall-E was having trouble navigating; I was using an algorithm that depended on the stability of the pointing direction (interrupt number) associated with the minimum distance value, and this was unstable to say the least. The minimum distance value jumped between approximately 43 and 0, and the associated interrupt number jumped between 0 and either 14 or 15. A distance value of ‘0’ results from a LIDAR distance measurement failure where the corrected distance is less than zero. Such values get replaced by ‘0’ before being loaded into the distance/angle array (and subsequently read out to the measurement laptop in this experiment).
So, what to do? I decided to try some ‘running average’ techniques to see if that would clean up the data and make it more usable for navigation. To do this I wrote up some VBA code to perform an N-point running average on the raw data, and produced results for N = 1, 3, and 5, as shown below.
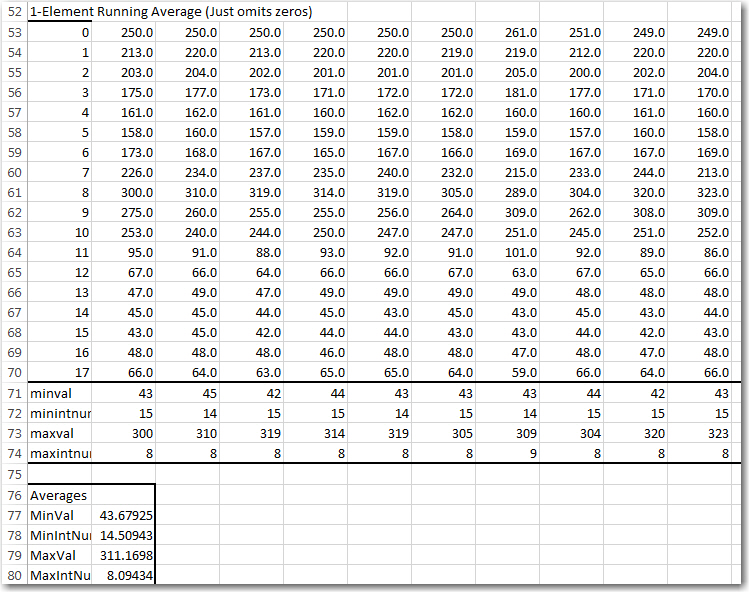
1-point running average (essentially just zero replacement with the preceding value)
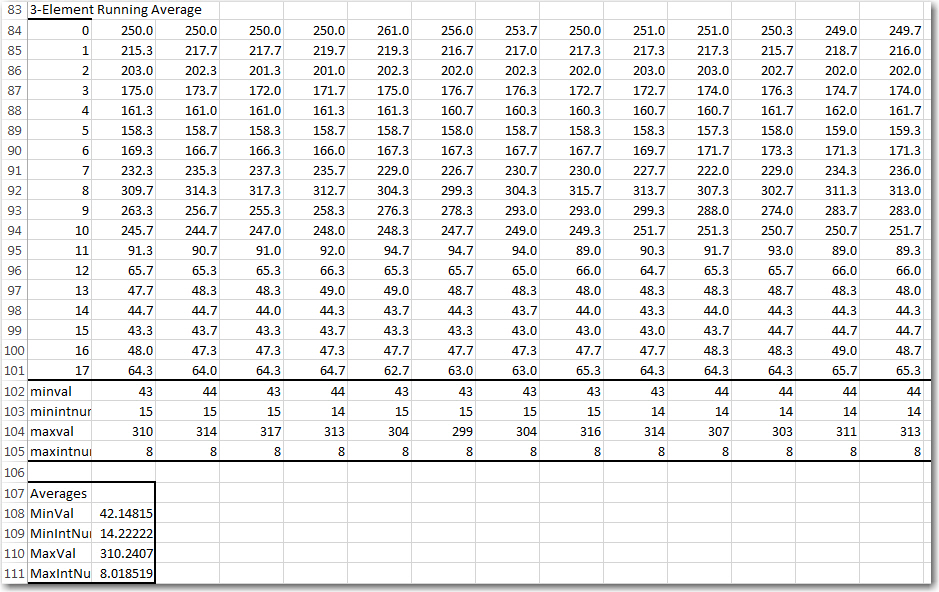
3-point running average, with zero runs longer than 3 replaced with preceding value(s)
5-point running average, with zero runs longer than 5 replaced with preceding value(s)
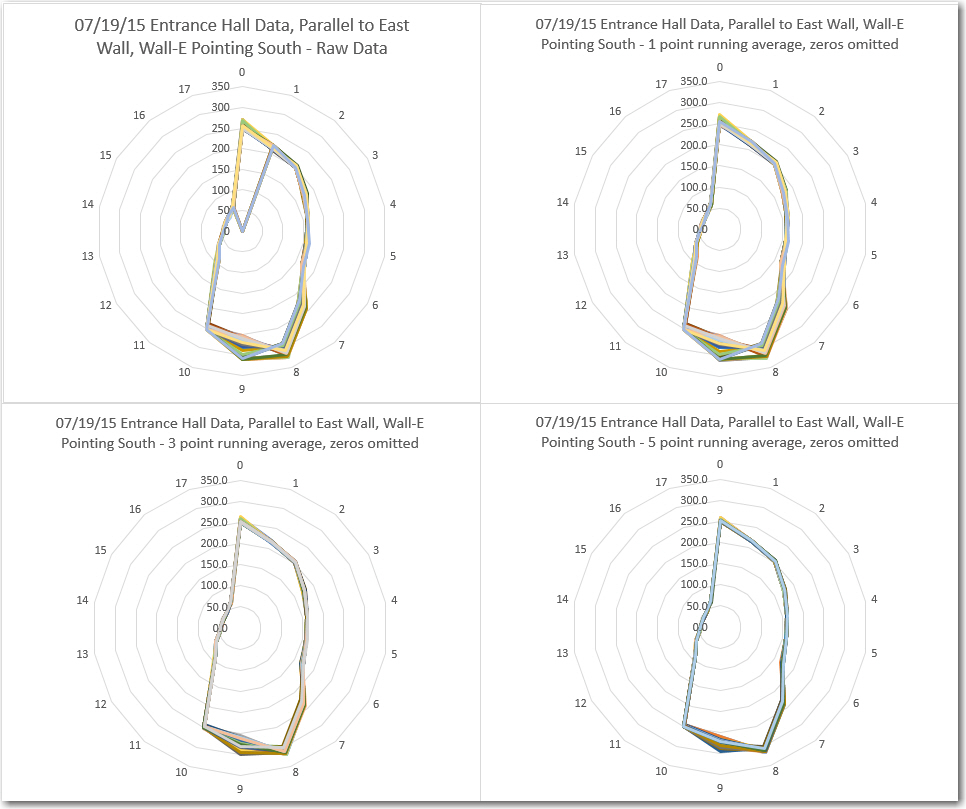
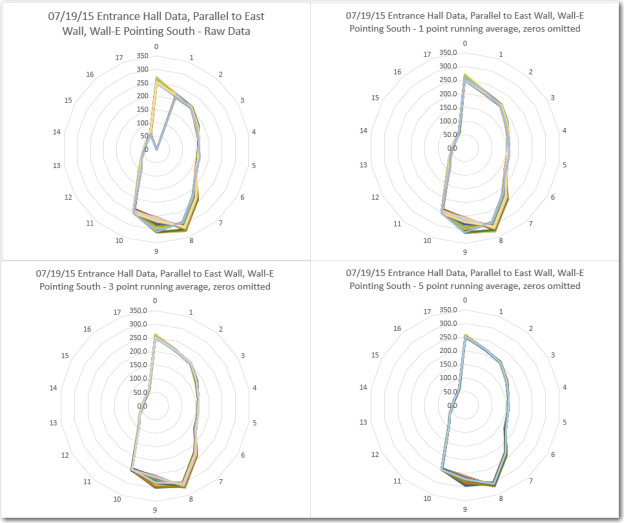
LIDAR distance ‘radar’ plots of raw, 1, 3, and 5-point running average
Looking at the above results and plots, it is clear that that there is very little difference between the 1, 3, and 5-point running average results. In all three cases, the min/max values are very stable, as are the associated interrupt numbers. So, it appears that all that is needed to significantly improve the data is just ‘zero-removal’. This should be pretty straight-forward in the current processing code, as all that is required is to NOT load a ‘bad’ measurement into the distance/angle table – just let the preceding one stay until a new ‘good’ result for that interrupt number is obtained. With two complete measurement cycles per second, this will mean that at least 0.5 sec will elapse before another measurement is taken in that direction, but (I think) navigating on slightly outdated information is better than navigating on badly wrong information.
Pingback: EMI Problems with LIDAR and Wall-E - Paynter's Palace