Posted 4/12/15
At the conclusion of my last post (New ‘stuck’ Detection Scheme, Part VI), I had decided that I needed to investigate the use of the EEPROM on board Wall-E’s Arduino Uno as a potential way of recording actual field data, in an effort to find out what is really happening when Wall-E gets stuck and can’t get un-stuck.
OK, so the plan is to add a pushbutton to Wall-E’s hardware to trigger sensor data collection into EEPROM. Then I can read the data out later using another program. I happened to have a fairly decent selection of pushbuttons from other projects, so this part wasn’t a problem. I decided to use an unused analog port (A5), with it’s pullup resistor enabled, so all the pushbutton has to do is pull that line to ground. Then I could modify Wall-E’s code to write sensor data to EEPROM for as long as the A5 line is LOW.
The following photos show the pushbutton hardware and wiring
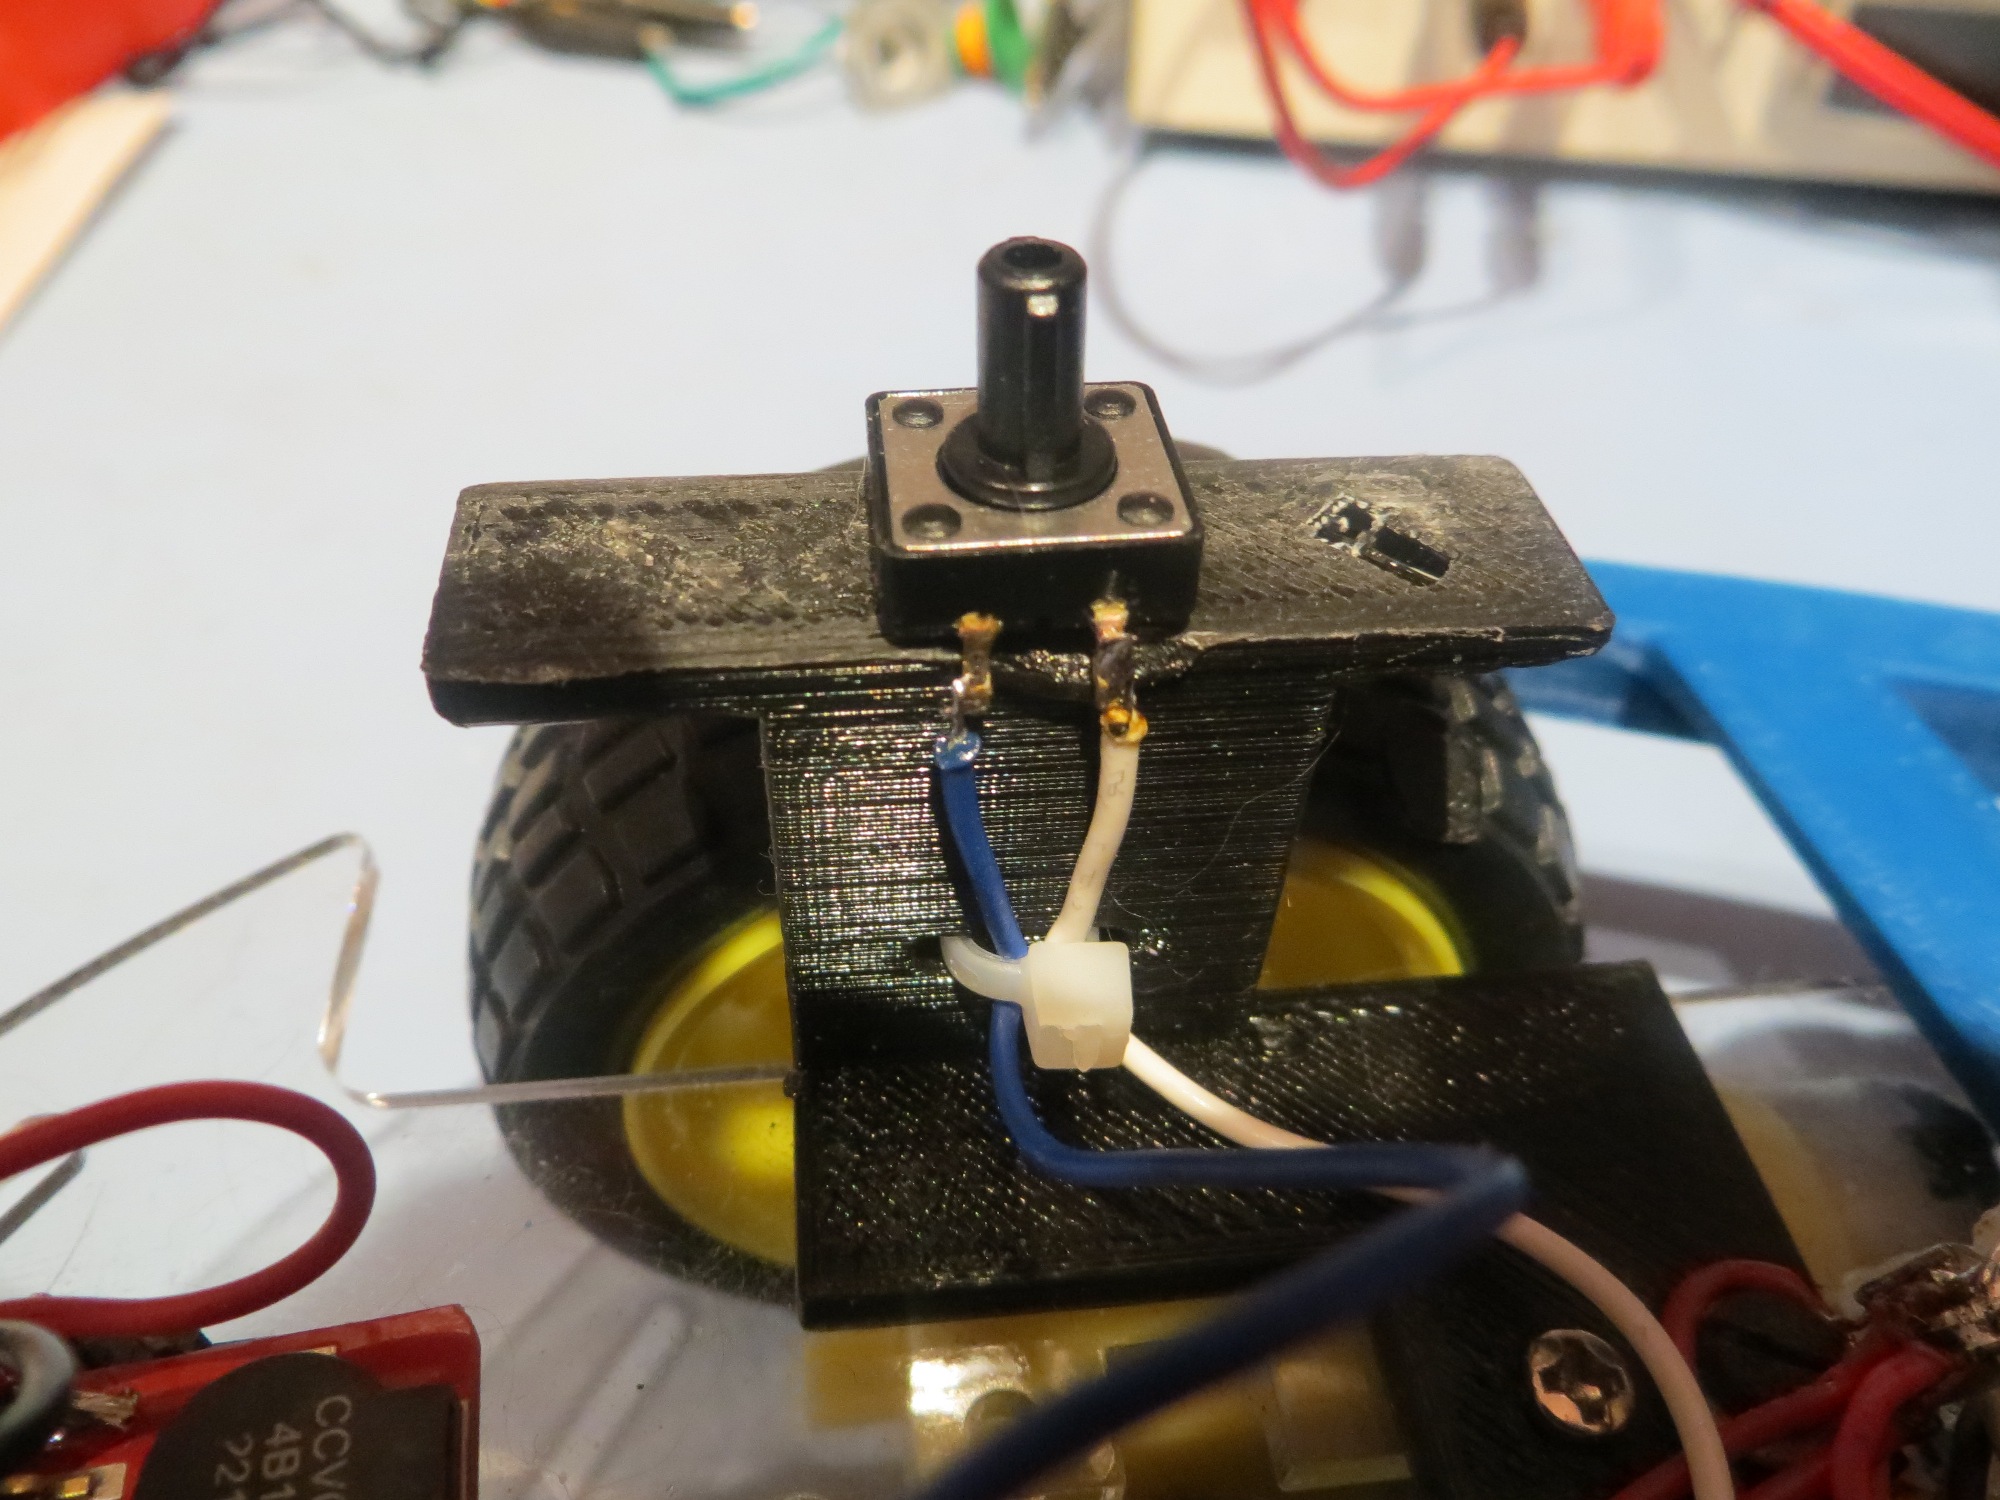
Side view showing pushbutton wiring and strain relief
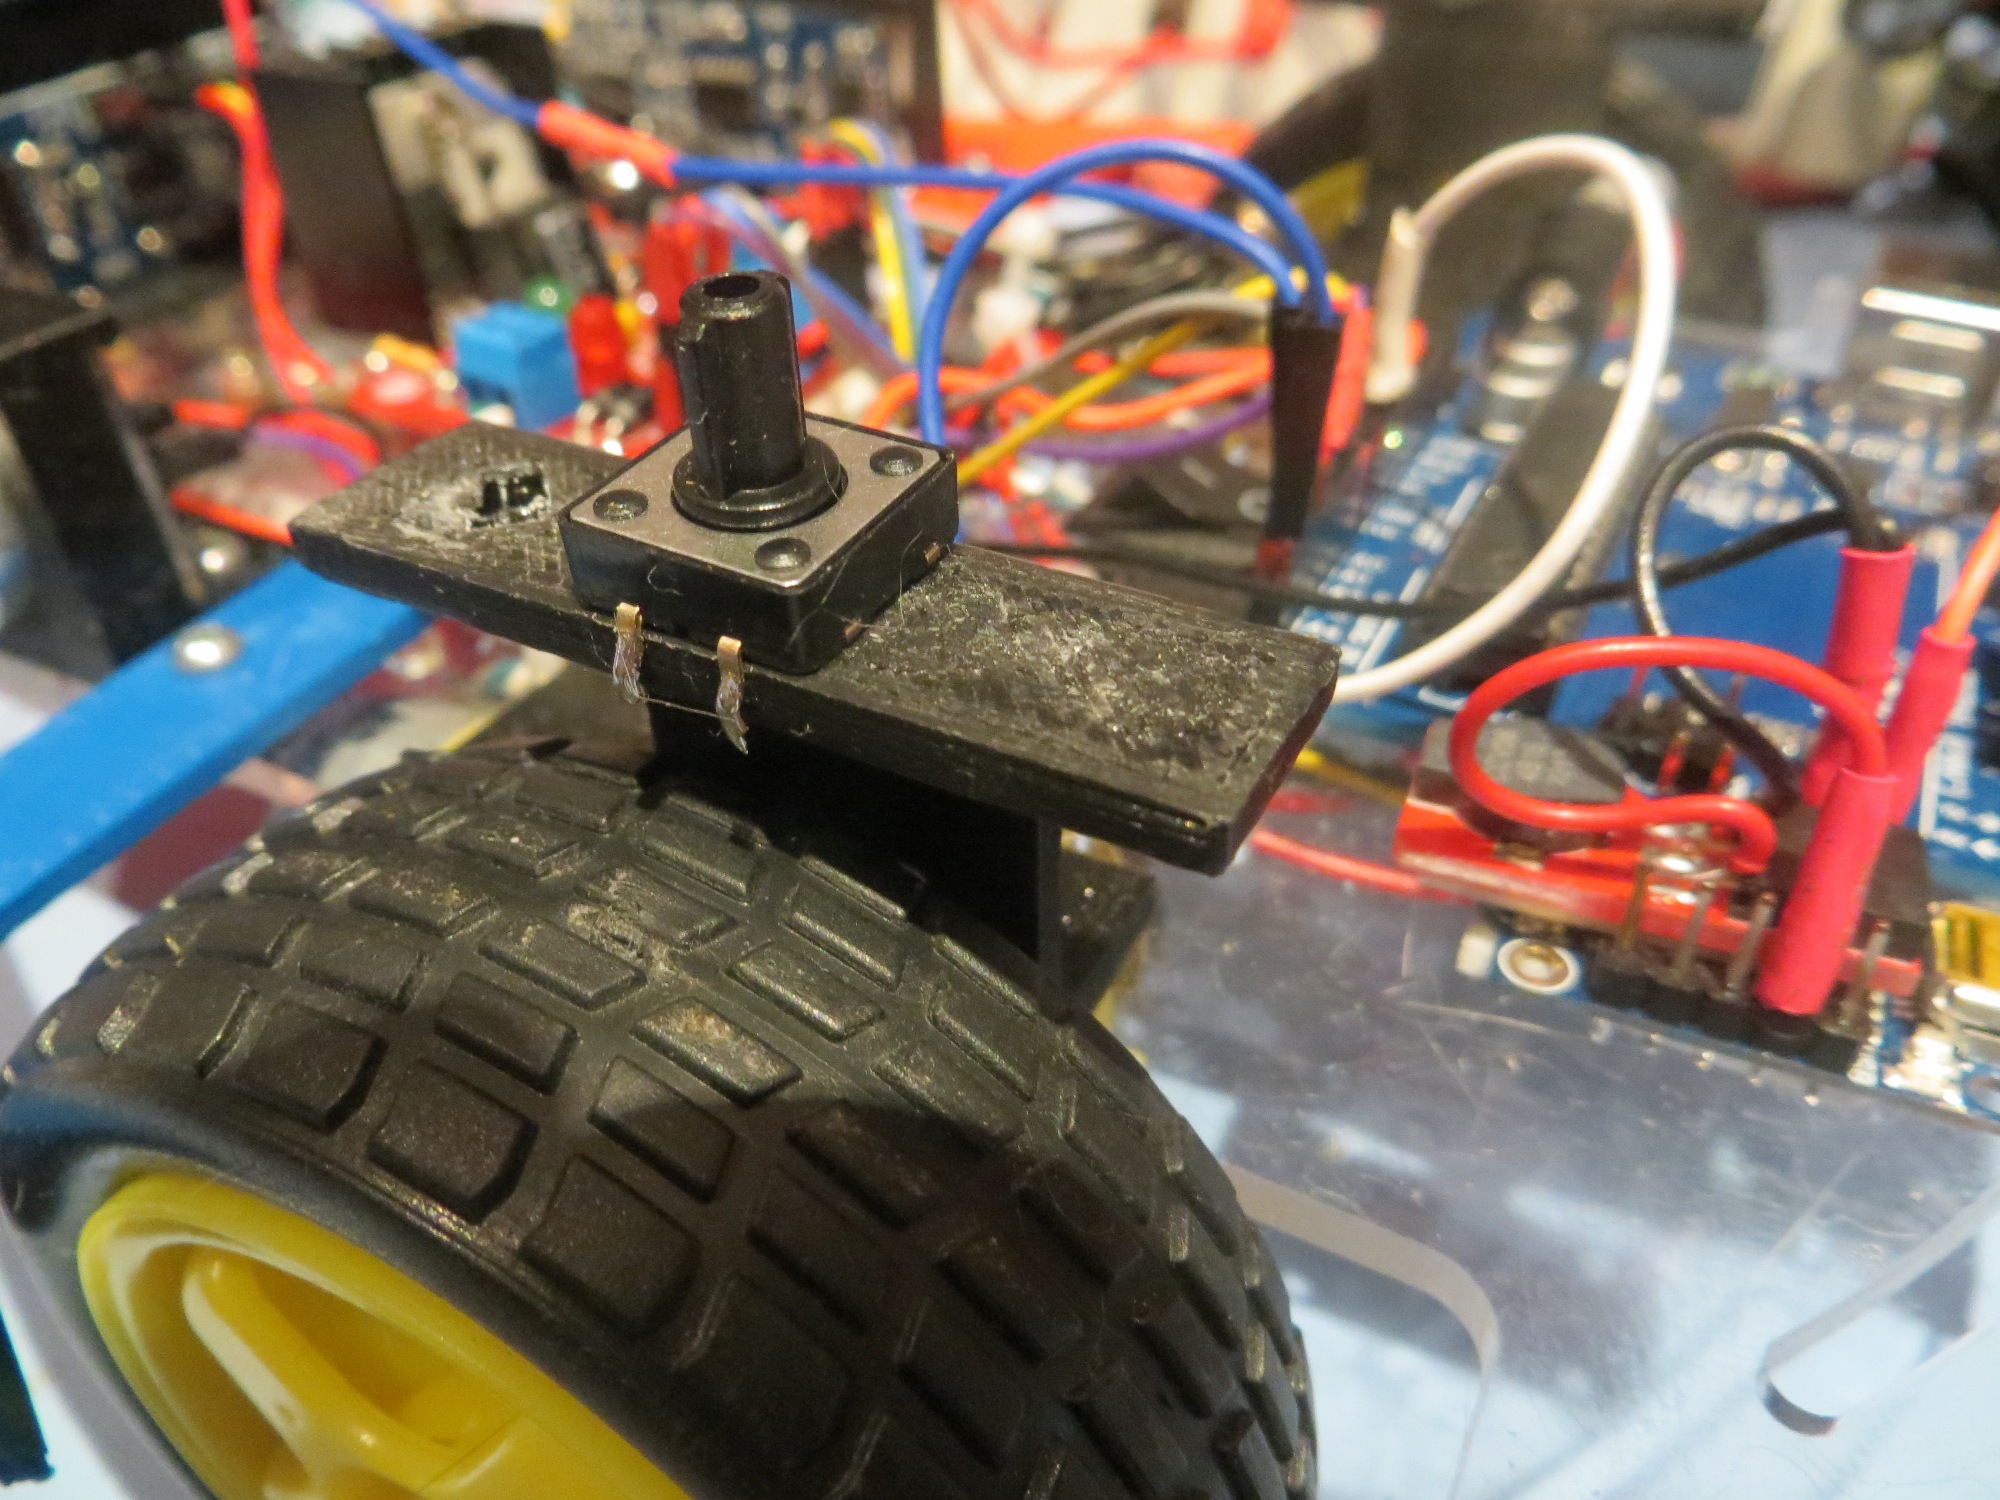
Side view showing pushbutton location on left wheel cover
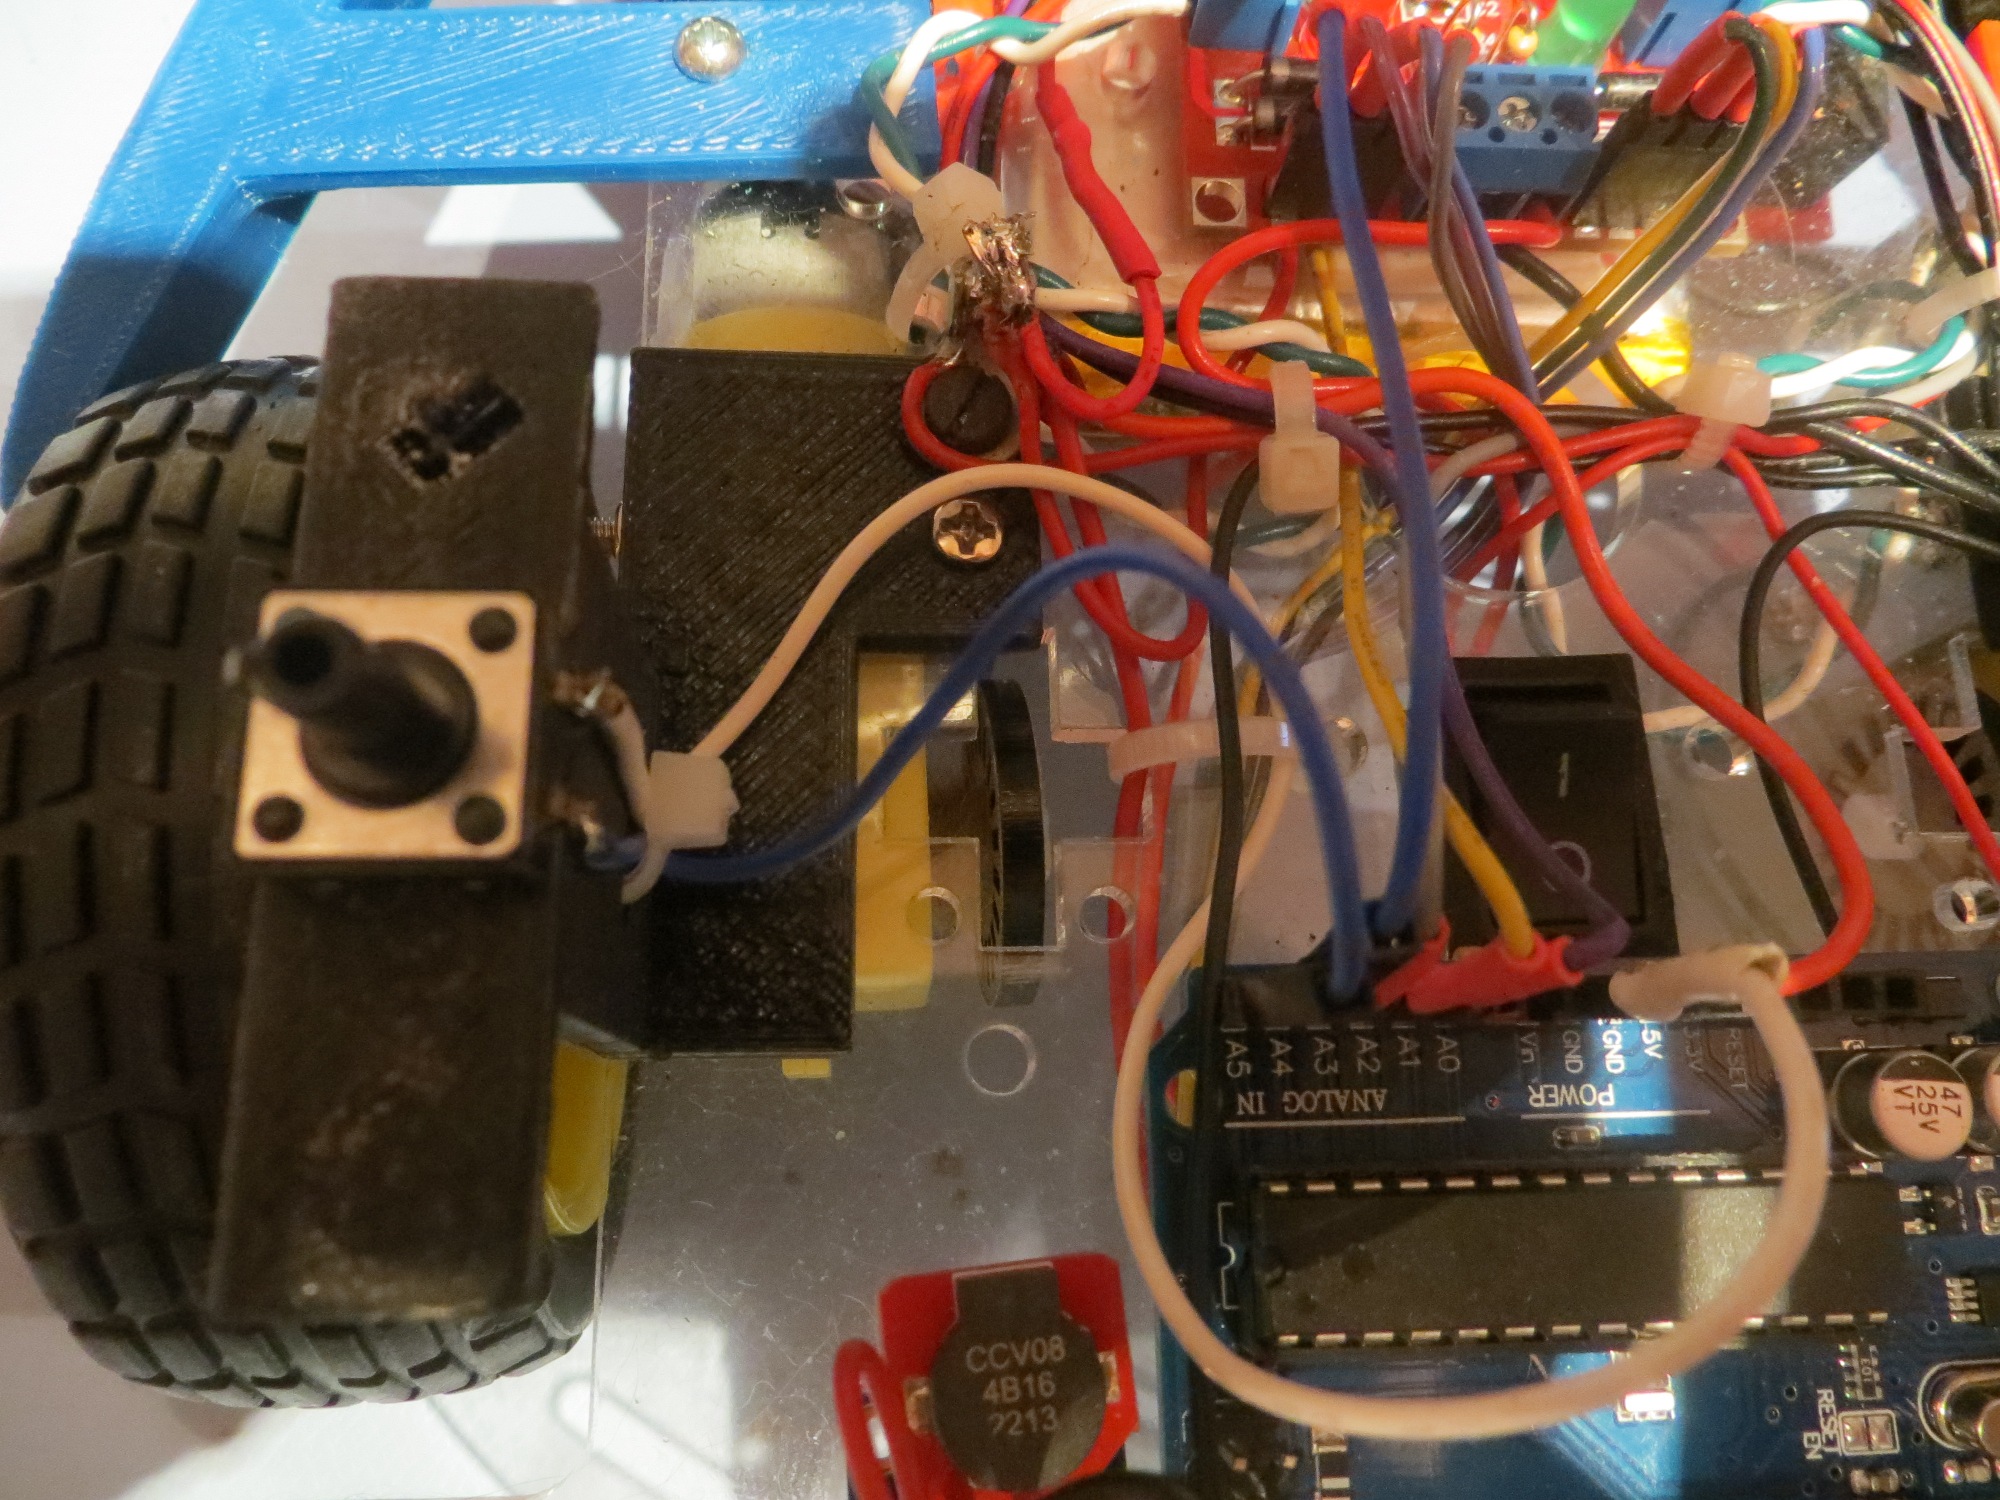
Top view showing pushbutton connections to the Arduino Uno
Next, I modified Wall-E’s code to write the current front and top-front sensor measurements to EEPROM in an interleaved fashion whenever the A5 line was LOW.
Next I wrote another small sketch to read the EEPROM values back out and de-interleave them into two columns of sensor measurements so it would be convenient to use Excel to plot results. After testing this on the bench, it was time to let Wall-E loose on the world to ‘go get stuck’. As if Wall-E could sense there was something wrong, it did its best to not get stuck. I had almost run out of patience when Wall-E ran into the base of one of our cat trees and stuck – grinding its wheels but not going anywhere. I was able to collect several seconds of data from the two front sensors – YES!!
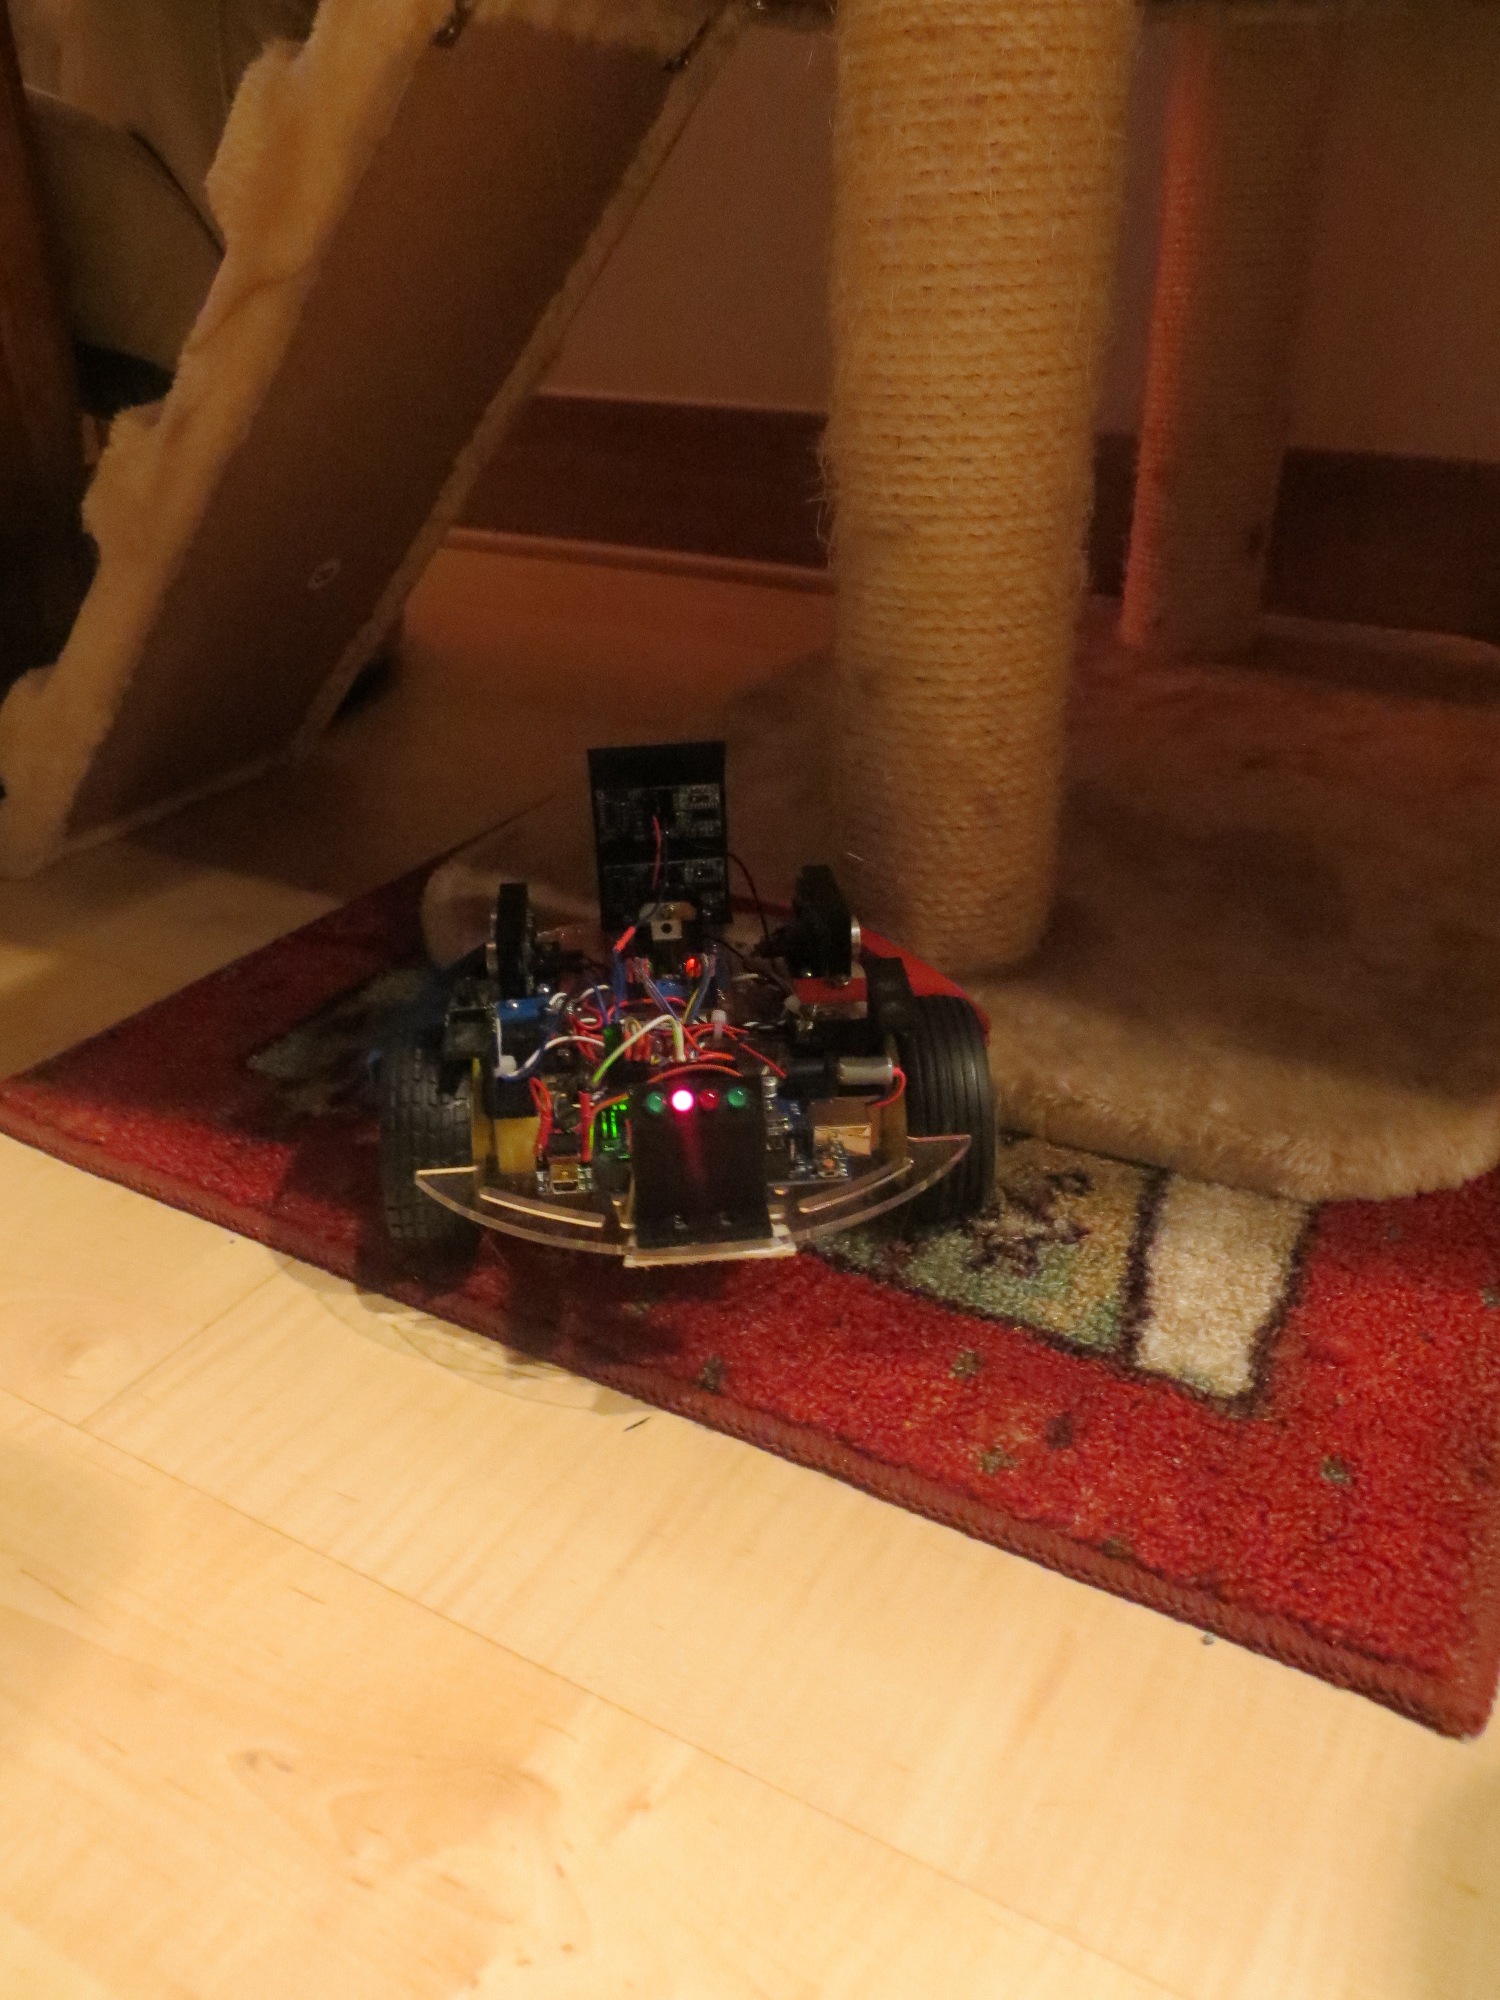
Wall-E stuck on the base of a cat tree
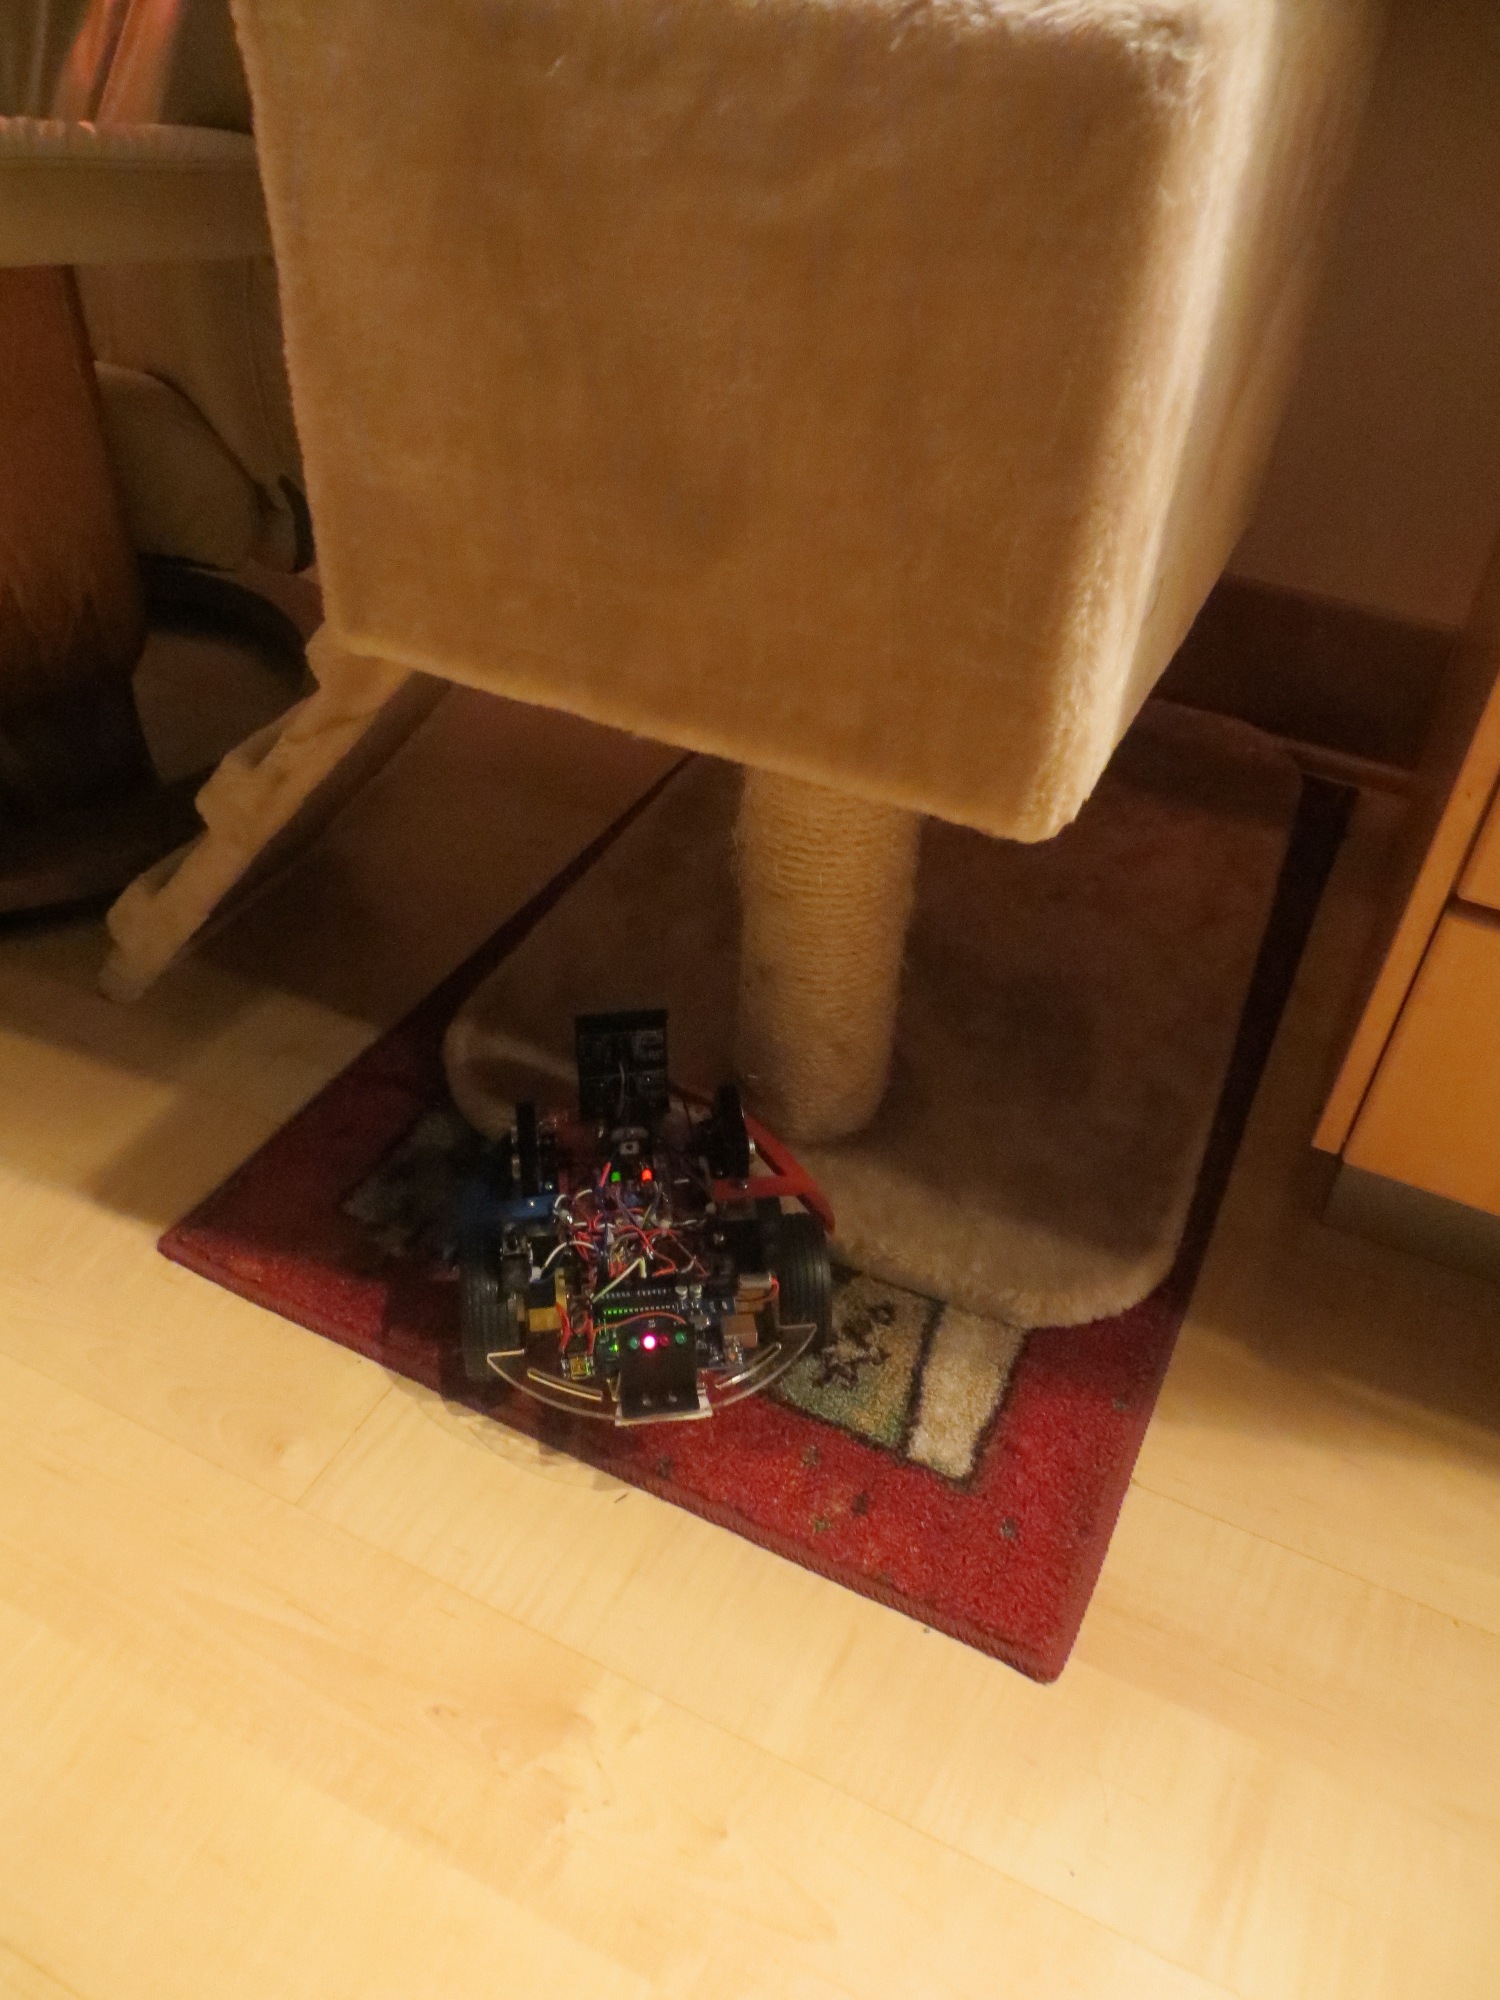
Wall-E stuck on the base of a cat tree
After loading the readout program, extracting the sensor data and sucking it into Excel, the following plot shows what I collected.
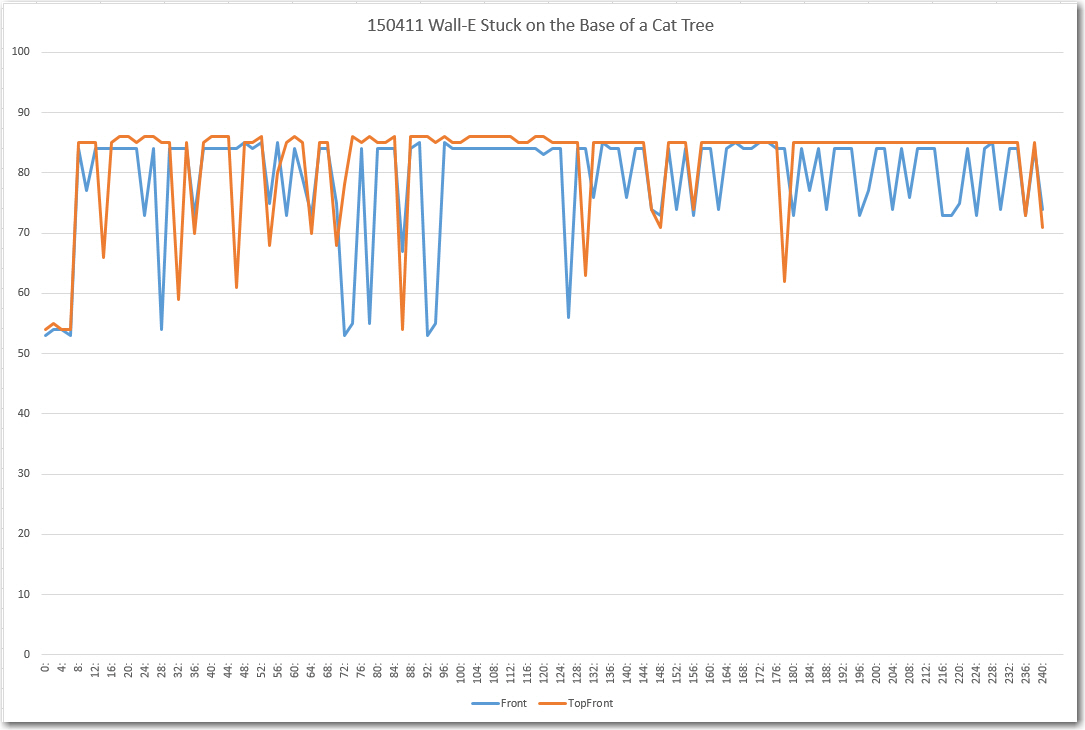
Excel plot of the front and top-front sensor data while Wall-E was stuck on the base of a cat tree
This was not what I was expecting to see! I had expected to see stable data, indicating that I had screwed up the algorithm somehow, and fixing the algorithm would fix the ‘stuck’ detection problem. Instead, the above plot clearly shows that it is the data that is screwed up, not the algorithm!
Looking more closely at the data, it appears that the stable sections around 85 cm are probably representative of the actual distance from Wall-E’s front sensors to the wall behind the cat tree. However, the only explanation I can come up with for the large variations in both sensor readings is some sort of multipath effect, caused by parts of the scene that aren’t directly ahead, but are in the view of the ping sensors. I have some experience with multipath effects from my time as a radar/antenna research scientist at The Ohio State University, and it is a very hard problem to deal with. Eliminating or suppressing multipath effects is basically impossible with single sensors, or even multiple co-located ones; in order to address multipath, a space-diversity scheme for sensors is required, where sensors are spaced far enough apart so that if a particular multipath path creates constructive interference at one sensor, it will create destructive interference at the other. Then the data from both sensors can be averaged to achieve a better, more stable result. This is infeasible to do for Wall-E, but maybe, just maybe, that isn’t totally necessary. Maybe I can look for the pattern of variation between the two front sensors shown above. Currently I’m looking for large differences in the total deviation between the front and top-front sensors, but this is essentially an averaging process. Maybe it would work to compare the two sensors on a measurement by measurement basis?
Stay Tuned…
Frank